Your Neighborhood's Air Quality
We combine data from our air quality monitoring network, NYCCAS, with other data to understand what makes air quality in one neighborhood different from air quality in another. We found that building emissions, building density, industrial areas, and traffic density are associated with differences in air quality.
If we don’t have an air quality monitor in one neighborhood, but we know its building density, its industrial area, and its traffic, then we can model (estimate or predict) its air quality - based on monitored air quality in similar neighborhoods.
About the data
Data for PM2.5 and NO2 are from 2023. Data for industrial areas are from 2022. Data on commercial cooking, traffic, and buildings are from 2019. For details on data sources and measurements, see NYCCAS Annual Report.
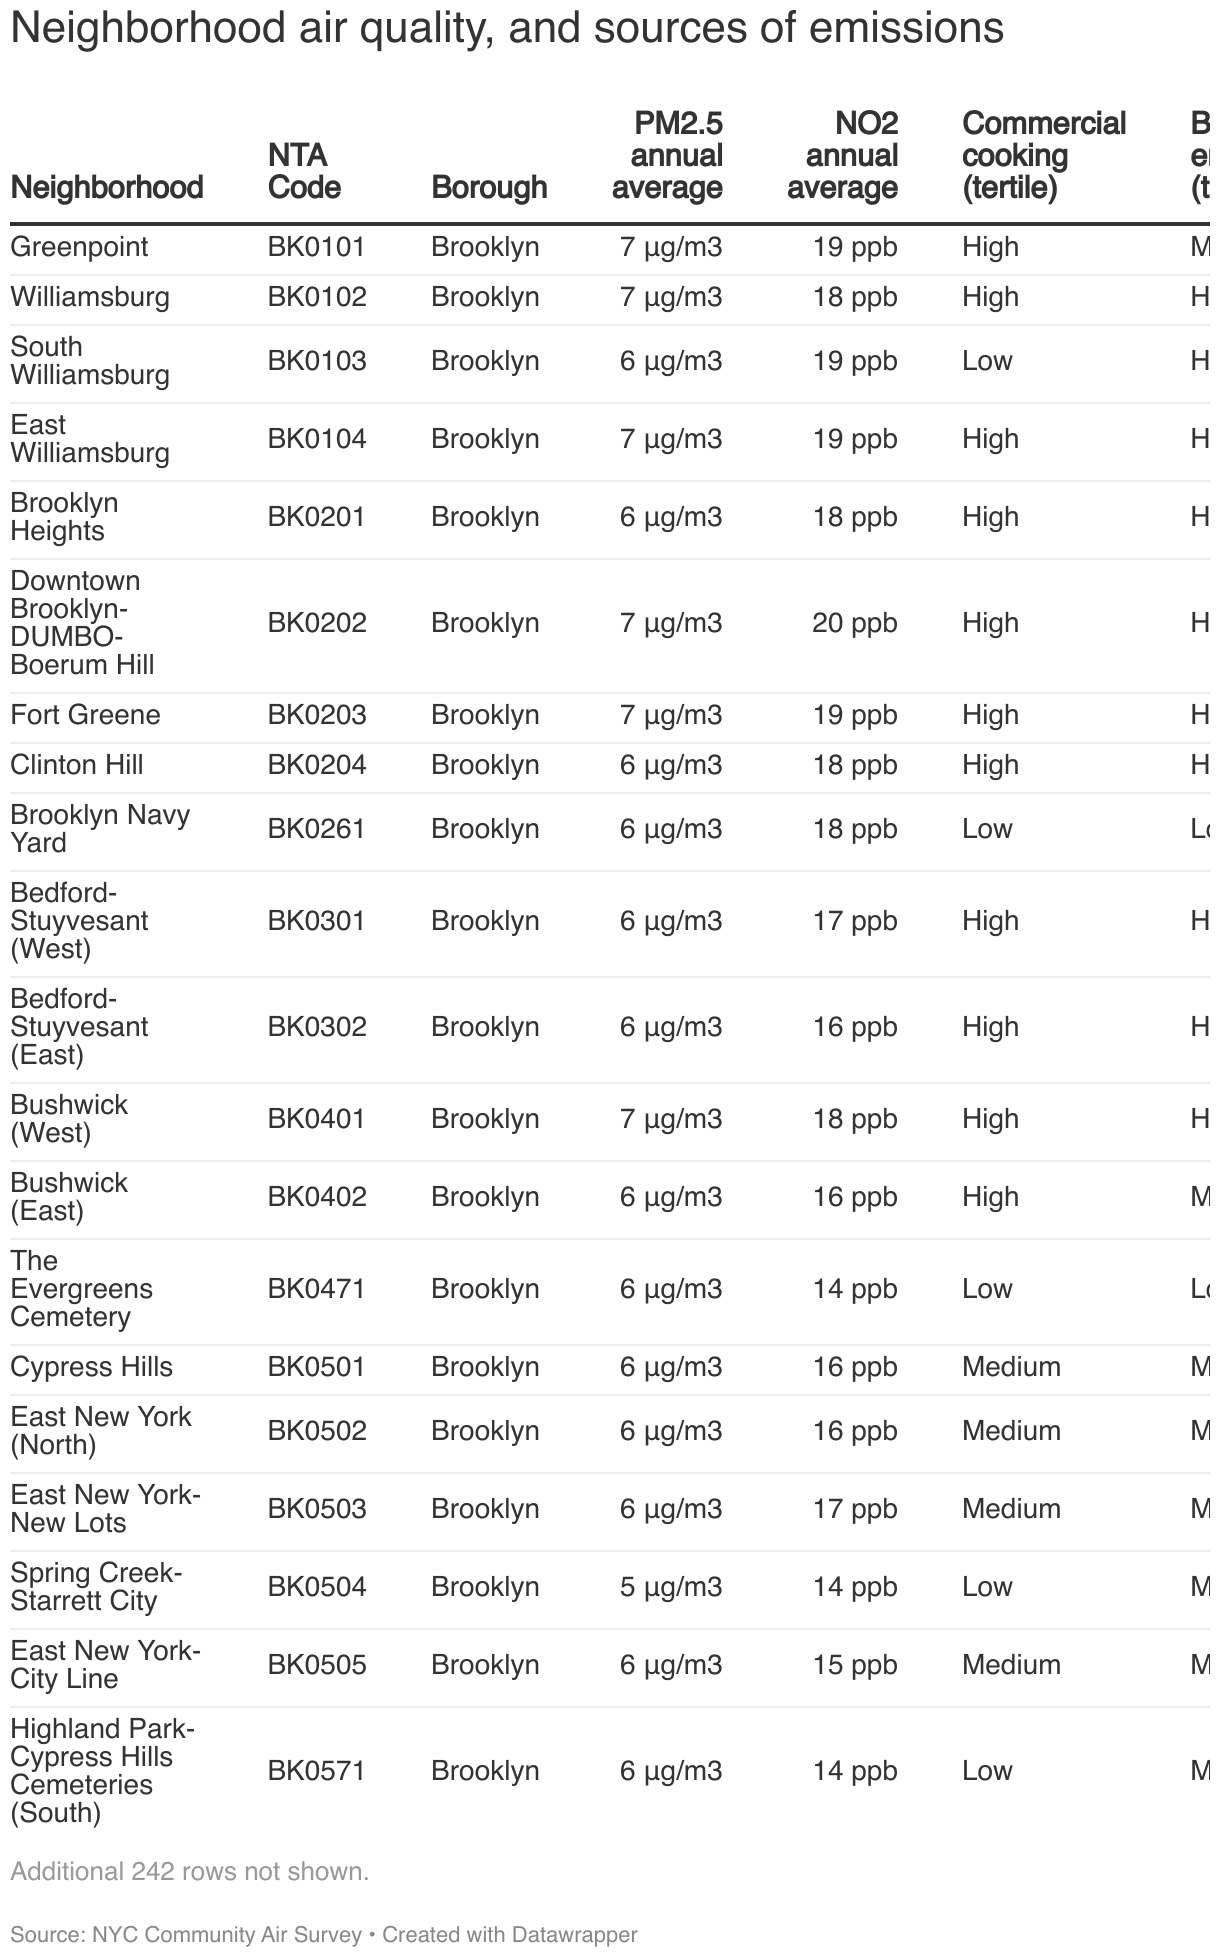
Air quality in your neighborhood
PM2.5
PM2.5, also called fine particles, worsens lung and heart diseases and are linked to cancer and premature death. NYC meets the EPA's annual average standard (measured in micrograms per cubic meter, or μg/m3), but short-term concentrations sometimes exceed this threshold.
| Area | PM2.5 |
|---|---|
| Your neighborhood | XXX μg/m3 |
| NYC Average | 5.8 μg/m3 |
| EPA Standard | 9 μg/m3 |
Nitrogen dioxide
Nitrogen dioxide is linked to asthma hospitalizations and other respiratory conditions. NYC meets the EPA's annual standard (measured in parts per billion, or ppb), but short-term concentrations sometimes exceed this threshold.
| Area | PM2.5 |
|---|---|
| Your neighborhood | XXX ppb |
| NYC Average | 14.7 ppb |
| EPA Standard | 53 ppb |
What affects air quality in your neighborhood?
Building emissions: XXX
Like vehicles, buildings burn fuel: their boilers run on oil or gas to produce heat and hot water. These boilers emit pollutants that affect your neighborhood's air quality.
Commercial cooking: XXX
Commercial cooking density - specifically, the density of restaurant permits to use charbroilers or open-fire grills without equipment to trap smoke and PM2.5 - is associated with higher levels of PM2.5 in the neighborhood.
Industrial area: XXX
Manufacturing can emit pollutants, construction can kick up particulate matter, and increased truck traffic can produce more emissions.
Traffic density: XXX
Traffic produces "tailpipe emissions" like PM2.5, NOx and carbon monoxide (CO), and tire wear and braking release additional particulate matter into the air.