Real-Time Air Quality: PM2.5 in NYC
Fine particles (PM2.5) are among the most harmful pollutants. Long-term exposure to PM2.5 contributes to an estimated 2,000 excess deaths from lung and heart disease each year in NYC (1 out of every 25 deaths in NYC), and short-term exposure contributes to asthma incidents severe enough to require a trip to the emergency department, and other health threats.
The air quality in NYC is generally good and has been improving over time. For PM2.5, NYC meets the National Ambient Air Quality Standard of an annual average under 9 μg/m3, and a 24-hour average under 35 μg/m3.
But hour to hour, there is large variation in our air quality - even in neighborhoods with the cleanest air. PM2.5 levels can spike to levels that can harm health, especially for people sensitive to air pollution. These higher levels are driven by daily changes in traffic volume, weather patterns that can trap emissions, and other short-term events.
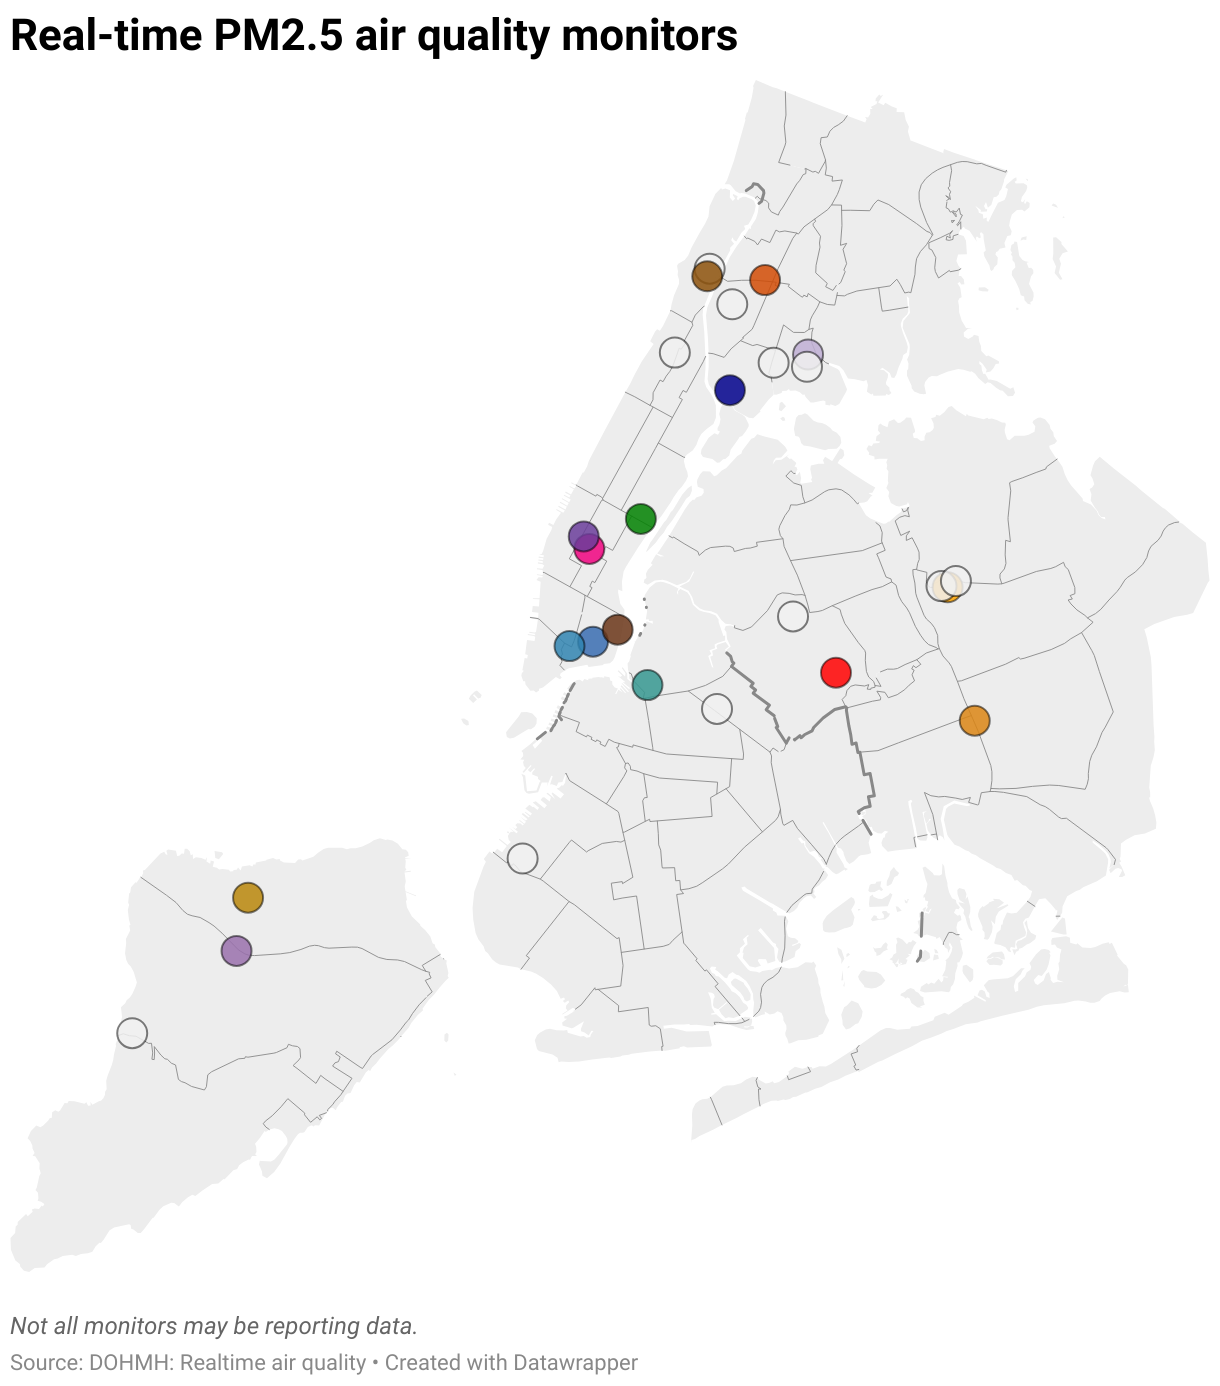
Explore real-time data on PM2.5 (fine particles) from our network of realtime air quality monitors around NYC.
About the data
Data are hourly measurements of PM2.5, in micrograms per cubic meter of air (µg/m3). External factors can sometimes affect monitor functioning and make data temporarily unavailable. Data are preliminary and subject to change. Times are in Eastern Standard Time.
Street-level monitors
Data come from the NYC Community Air Survey’s street-level monitors, which measure ground-level exposures. The BQE, FDR, Mott Haven, Van Wyck, Hamilton Bridge, and SI Expwy sites are supported with funds from the MTA’s CBD Tolling Program. We apply a calibration factor to make our data comparable to DEC data and historical EPA data.
NYS DEC Monitors
We show the average readings from 11 rooftop monitors from the NY State Department of Environmental Conservation (DEC), which collects data for the Federal Clean Air Act.
Download accessible data
This page contains visualizations. If you are using a screenreader, you can download a CSV file of the last 7 days of realtime air quality data.
| Location | Sort | Last 24 hours (µg/m3) |
|---|
All levels are below the NAAQS 24-hour standard (35 µg/m3)
Sources of emissions vary
In NYC, about 30% of PM2.5 comes from far-away sources like coal-burning power plants in the Midwest. But more than half comes from local sources.
Building density affects a neighborhood's air quality because like vehicles, buildings burn fuel and emit pollutants: their boilers burn oil and gas to produce heat and hot water. This is one reason we often see more air pollution in the winter. Because of new heating oil regulations, PM2.5 has gone down dramatically, and SO2 levels are now indetectable. Read more at the NYCCAS annual report.
Industrial areas affect a neighborhood's air quality because of diesel exhaust from trucks idling and traveling through industrial areas, and from industrial combustion equipment.
Traffic density affects a neighborhood's air quality because engines produce PM2.5, black carbon, and NOx. While electric vehicles help reduce emissions, all vehicles also contribute to PM2.5 through tire wear and braking. Traffic volume is one reason we often see daily spikes in PM2.5 concentration in the mornings and evenings.
Truck traffic density affects a neighborhood's air quality because diesel combustion produces additional pollutants.
Common patterns in the data
There are several patterns that commonly show up in the data from our air quality monitors. Look at recent data for patterns that indicate:
The monitors are in neighborhoods with different emissions sources, so have different PM2.5 levels. Midtown, which has the highest traffic density, usually has the most PM2.5.
PM2.5 levels usually rise in the morning as traffic volume increases. These temporal differences (time spikes) are usually greater than spatial differences (the differences between neighborhoods). It's very rare for these spikes to exceed the National Ambient Air Quality Standard of 35 μg/m3 for 24 hours.
Weather can trap emissions and cause PM2.5 to build up. Sometimes we see a clear west-to-east pattern in rising PM2.5, as weather patterns moving into NYC traps local emissions. Other times, weather can bring wildfire smoke from far-away fires.
Sometimes there are dramatic, short-term spikes at unexpected times, and without having a camera on each monitor, we don't know what causes them. However, they can be explained by something as simple as a truck idling for a few minutes underneath the monitor.
Explore the effects of Congestion Pricing
Interested in seeing if congestion pricing affects air quality? You can use real-time air quality data to get a quick sense of how congestion pricing is affecting PM2.5 levels in NYC. You can download this data to compare air pollution trends at sites that might be affected by congestion pricing — for example Midtown-West, or the Cross Bronx Expressway — to trends at the Van Wyck, a site we don't think will see changes in traffic due to congestion pricing. Changing traffic patterns will underlie any differences in air quality we see that relate to congestion pricing. You can find detailed traffic pattern data via the MTA.
Limitations on short-term and small sample comparisonsBecause air pollution can vary from day to day for many reasons, we need data from a longer time period to reliably determine whether congestion pricing has affected air quality in different parts of the city. That’s why we will collect a full year of data before we do a more rigorous analysis with a larger sample size. This analysis will account for multiple variables, including traffic data, and other air pollutants associated with traffic, like NO2 and BC.
The Air Quality Index
The Air Quality Index is the US Environmental Protection Agency's way of reporting air quality. It reports whether any of five major pollutants (ground-level ozone, fine particles, carbon monoxide, sulfur dioxide and nitrogen dioxide) are at levels that can harm health.
AQI Resources:
Community air quality programs
Many community-based organizations run independent air quality monitoring systems, which contribute to the broader picture of air quality and health in NYC.
South Bronx Unite: Air pollution and health
WE ACT for Environmental Justice: QuantAQ
Red Hook Initiative: US EPA PM2.5 by Purple Air
Sixth Street Center: AirCasting
Does your organization conduct hyperlocal air quality monitoring? Get in touch at ehdp@health.nyc.gov.