Outdoor Air and Health in
East Flatbush - Flatbush| Metric | Value |
|---|---|
| Population | XX,XXX |
| Over age 65 | YY% |
| Under age 18 | YY% |
| Poverty | YY% |
| Graduated high school | YY% |
| Limited English | YY% |
| Owner-occupied homes | YY% |
| Rent-burdened households | YY% |
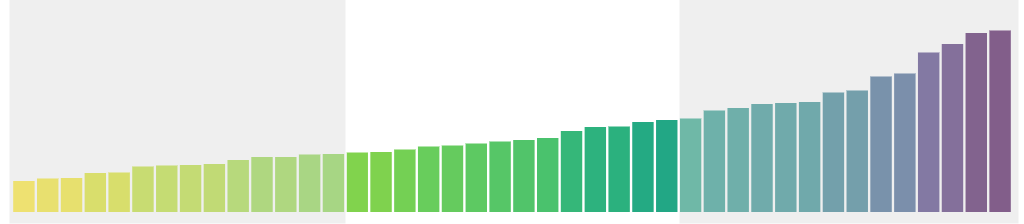
For each dataset, we divide neighborhoods up into tertiles, or thirds. This provides a rough comparison of this neighborhood, to all other NYC neighborhoods, for this indicator.
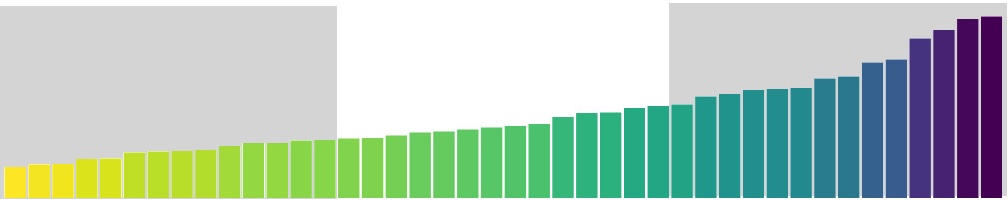
These are only based on the distribution of data values, not the range. The absolute values of indicators in different categories may not be all that different.
Outdoor Air and Health in
East Flatbush - FlatbushAir pollution is one of the most important environmental threats to people who live in urban areas. Exposures are linked to respiratory and heart diseases, cancers, and premature deaths. Meanwhile, emissions, levels of exposure, and population vulnerability vary across neighborhoods.
Outdoor air pollutants
Common air pollutants that can worsen asthma, and result in illness or death.
Concentration of fine particles in the air. Fine particles are emitted by vehicles, building boilers, and other combustion — and are a major form of air pollution that harms health. Neighborhood sensors measure PM2.5 at the street-level, where people are most active. These sensors are designed to let us measure differences in air pollution over time and locations within New York City.
PM2.5 (Fine particles) in East Flatbush - Flatbush:
Less than most neighborhoods
the Brooklyn average
(boro val mcg/m3)
the Citywide average
(city val mcg/m3)
In Brooklyn, it is [TREND]. Citywide, the trend is [TREND].
Source: New York City Community Air Survey
Concentration of black carbon in the air. Black carbon is a major component of fine particles, which contribute to both short-term health effects and chronic illness
Black carbon in East Flatbush - Flatbush:
Less than most neighborhoods
the Brooklyn average
(boro val absorbance units)
the Citywide average
(city val absorbance units)
In Brooklyn, it is [TREND]. Citywide, the trend is [TREND].
Source: New York City Community Air Survey
Concentration of nitrogen dioxide in the air. Nitrogen dioxide is a pollutant formed by combustion. It causes breathing problems and contributes to smog and acid rain.
Nitrogen dioxide in East Flatbush - Flatbush:
In the middle of neighborhoods
the Brooklyn average
(boro val ppb)
the Citywide average
(city val ppb)
In Brooklyn, it is [TREND]. Citywide, the trend is [TREND].
Source: New York City Community Air Survey
Concentration of ozone in the air. Ozone is a common air pollutant that can harm breathing and worsen respiratory conditions.
Ozone in East Flatbush - Flatbush:
Higher than most neighborhoods
the Brooklyn average
(boro val ppb)
the Citywide average
(city val ppb)
In Brooklyn, it is [TREND]. Citywide, the trend is [TREND].
Source: New York City Community Air Survey
Heating fuel emissions
Air pollution often rises in the winter because buildings burn oil and gas for heat and hot water.
Boilers are a common source of SO2, which can worsen lung disease.
Boiler emissions (SO2) in East Flatbush - Flatbush:
In the middle of neighborhoods
the Brooklyn average
(boro val per square kilometer)
the Citywide average
(city val per square kilometer)
In Brooklyn, it is [TREND]. Citywide, the trend is [TREND].
Source: New York City Community Air Survey
Boilers are a common source of PM2.5, which can harm health.
Boiler emissions (PM2.5) in East Flatbush - Flatbush:
In the middle of neighborhoods
the Brooklyn average
(boro val per square kilometer)
the Citywide average
(city val per square kilometer)
In Brooklyn, it is [TREND]. Citywide, the trend is [TREND].
Source: New York City Community Air Survey
Boilers are a common source of NOx emissions, which can harm health.
Boiler emissions (NOx) in East Flatbush - Flatbush:
In the middle of neighborhoods
the Brooklyn average
(boro val per square kilometer)
the Citywide average
(city val per square kilometer)
In Brooklyn, it is [TREND]. Citywide, the trend is [TREND].
Source: New York City Community Air Survey
Outdoor air toxics
Pollutants that can cause cancer.
Formaldehyde is an air pollutant resulting from car exhaust and the manufacture of industrial products. Formaldehyde is a known carcinogen that can also cause irritation to eyes and lungs and increase risk of asthma and trigger asthma symptoms.
Formaldehyde in East Flatbush - Flatbush:
In the middle of neighborhoods
the Brooklyn average
(boro val µg/m3)
the Citywide average
(city val µg/m3)
In Brooklyn, it is [TREND]. Citywide, the trend is [TREND].
Source: United States Environmental Protection Agency (EPA) Air Quality System (AQS) Data
Benzene is an air pollutant resulting from motor vehicle and industrial emissions and tobacco smoke. Benzene is a known carcinogen that can also harm bone marrow and red blood cell function.
Benzene in East Flatbush - Flatbush:
Higher than most neighborhoods
the Brooklyn average
(boro val µg/m3)
the Citywide average
(city val µg/m3)
In Brooklyn, it is [TREND]. Citywide, the trend is [TREND].
Source: United States Environmental Protection Agency (EPA) Air Quality System (AQS) Data
Traffic density
The amount of cars, trucks, and busses traveling through a neighborhood can affect air pollution.
Annual vehicle miles travelled by trucks. Traffic density can influence health as a source of air pollution and traffic-related injuries.
Truck traffic in East Flatbush - Flatbush:
Less than most neighborhoods
the Brooklyn average
(boro val per square mile)
the Citywide average
(city val per square mile)
In Brooklyn, it is [TREND]. Citywide, the trend is [TREND].
Source: New York Metropolitan Transportation Council Best Practice Model
Annual vehicle miles travelled. Traffic density can influence health as a source of air pollution and traffic-related injuries.
Traffic in East Flatbush - Flatbush:
In the middle of neighborhoods
the Brooklyn average
(boro val per square mile)
the Citywide average
(city val per square mile)
In Brooklyn, it is [TREND]. Citywide, the trend is [TREND].
Source: New York Metropolitan Transportation Council Best Practice Model
Annual vehicle miles travelled by cars. Traffic density can influence health as a source of air pollution and traffic-related injuries.
Car traffic in East Flatbush - Flatbush:
In the middle of neighborhoods
the Brooklyn average
(boro val per square mile)
the Citywide average
(city val per square mile)
In Brooklyn, it is [TREND]. Citywide, the trend is [TREND].
Source: New York Metropolitan Transportation Council Best Practice Model
Health burden: fine particles (pm2.5)
PM2.5 air pollution can cause or worsen asthma and other lung and heart conditions, as well as cause death.
Estimated annual deaths due to PM2.5 air pollution. Estimating these deaths is a way to understand how air pollution increases mortality.
Deaths from PM2.5 in East Flatbush - Flatbush:
In the middle of neighborhoods
the Brooklyn average
(boro val per 100,000 adults)
the Citywide average
(city val per 100,000 adults)
In Brooklyn, it is [TREND]. Citywide, the trend is [TREND].
Source: USEPA Air Quality System; Krewski D, et al. (2009) HEI Research Report 140. Health Effects Institute, Boston, MA; New York City Bureau of Vital Statistics; United States Census
Hospitalizations for respiratory issues due to PM2.5 pollution (among people over age 20). These represent part of the health burden of air pollution.
PM2.5 health burden (lungs) in East Flatbush - Flatbush:
In the middle of neighborhoods
the Brooklyn average
(boro val per 100,000 adults)
the Citywide average
(city val per 100,000 adults)
In Brooklyn, it is [TREND]. Citywide, the trend is [TREND].
Source: USEPA Air Quality System; Moolgavkar SH (2000) Inhal Toxicol 12(Supp 4):75-90; Zanobetti etal.(2009) Environ Hlth 8:58. doi:10.1186/1476-069X-8-58; New York State Statewide Planning and Research Cooperative System (SPARCS); US Census
ED visits for asthma due to PM2.5 air pollution. These represent part of the health burden of air pollution.
PM2.5 asthma ED visits (children) in East Flatbush - Flatbush:
Higher than most neighborhoods
the Brooklyn average
(boro val per 100,000 children)
the Citywide average
(city val per 100,000 children)
In Brooklyn, it is [TREND]. Citywide, the trend is [TREND].
Source: USEPA Air Quality System; Ito K et al. (2007) J Expo Sci Environ Epidemiol 17:S45-S60; New York State Statewide Planning and Research Cooperative System (SPARCS); US Census
Hospitalizations for cardiovascular issues due to PM2.5 (among people over age 40). These represent part of the health burden of air pollution.
PM2.5 health burden (heart) in East Flatbush - Flatbush:
Higher than most neighborhoods
the Brooklyn average
(boro val per 100,000 adults)
the Citywide average
(city val per 100,000 adults)
In Brooklyn, it is [TREND]. Citywide, the trend is [TREND].
Source: US EPA Air Quality System; Ito K et al (2011) Environ Hlth Persp, 119(4):467-473; New York State Statewide Planning and Research Cooperative System (SPARCS); US Census
ED visits for asthma due to PM2.5 air pollution. These represent part of the health burden of air pollution.
PM2.5 asthma ED visits (adults) in East Flatbush - Flatbush:
Higher than most neighborhoods
the Brooklyn average
(boro val per 100,000 adults)
the Citywide average
(city val per 100,000 adults)
In Brooklyn, it is [TREND]. Citywide, the trend is [TREND].
Source: USEPA Air Quality System; Ito K et al. (2007) J Expo Sci Environ Epidemiol 17:S45-S60; New York State Statewide Planning and Research Cooperative System (SPARCS); US Census
Health burden: ozone (o3)
Ozone (O3) air pollution can cause or worsen asthma and other lung and heart conditions, as well as cause death.
Hospitalizations for asthma due to ozone. These are part of the health burden of air pollution.
Ozone asthma hospitalizations (adults) in East Flatbush - Flatbush:
In the middle of neighborhoods
the Brooklyn average
(boro val per 100,000 adults)
the Citywide average
(city val per 100,000 adults)
In Brooklyn, it is [TREND]. Citywide, the trend is [TREND].
Source: US EPA Air Quality System; Silverman RA, Ito K (2010) J Allergy Clin Immun 125(2):367-373; New York State Statewide Planning and Research Cooperative System (SPARCS); US Census
Deaths due to cardiac or respiratory issues linked to ozone. These show how air pollution increases mortality.
Deaths from ozone in East Flatbush - Flatbush:
Higher than most neighborhoods
the Brooklyn average
(boro val per 100,000)
the Citywide average
(city val per 100,000)
In Brooklyn, it is [TREND]. Citywide, the trend is [TREND].
Source: USEPA Air Quality System; Huang Y et al. (2005) Environmetrics 16:547-562; New York City Bureau of Vital Statistics; United States Census
ED visits for asthma due to ozone. These are part of the health burden of air pollution.
Ozone asthma ED visits (children) in East Flatbush - Flatbush:
Higher than most neighborhoods
the Brooklyn average
(boro val per 100,000 children)
the Citywide average
(city val per 100,000 children)
In Brooklyn, it is [TREND]. Citywide, the trend is [TREND].
Source: USEPA Air Quality System; Ito K et al. (2007) J Expo Sci Environ Epidemiol 17:S45-S60; New York State Statewide Planning and Research Cooperative System (SPARCS); US Census
Hospitalizations for asthma due to ozone. These are part of the health burden of air pollution.
Ozone asthma hospitalizations (children) in East Flatbush - Flatbush:
Higher than most neighborhoods
the Brooklyn average
(boro val per 100,000 children)
the Citywide average
(city val per 100,000 children)
In Brooklyn, it is [TREND]. Citywide, the trend is [TREND].
Source: US EPA Air Quality System; Silverman RA, Ito K (2010) J Allergy Clin Immun 125(2):367-373; New York State Statewide Planning and Research Cooperative System (SPARCS); US Census
ED visits for asthma due to ozone. These are part of the health burden of air pollution.
Ozone asthma ED visits (adults) in East Flatbush - Flatbush:
Higher than most neighborhoods
the Brooklyn average
(boro val per 100,000 adults)
the Citywide average
(city val per 100,000 adults)
In Brooklyn, it is [TREND]. Citywide, the trend is [TREND].
Source: USEPA Air Quality System; Ito K et al. (2007) J Expo Sci Environ Epidemiol 17:S45-S60; New York State Statewide Planning and Research Cooperative System (SPARCS); US Census
View this report online: