Active Design, Physical Activity and Health in
Port Richmond| Metric | Value |
|---|---|
| Population | XX,XXX |
| Over age 65 | YY% |
| Under age 18 | YY% |
| Poverty | YY% |
| Graduated high school | YY% |
| Limited English | YY% |
| Owner-occupied homes | YY% |
| Rent-burdened households | YY% |
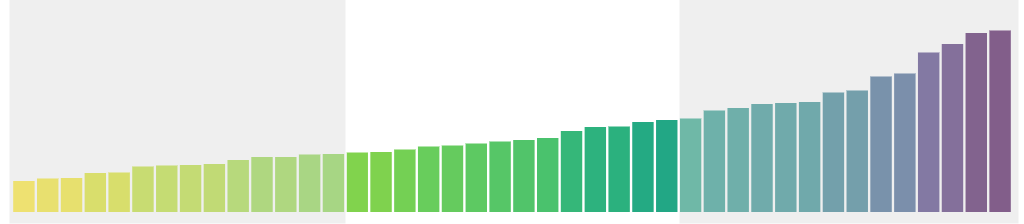
For each dataset, we divide neighborhoods up into tertiles, or thirds. This provides a rough comparison of this neighborhood, to all other NYC neighborhoods, for this indicator.
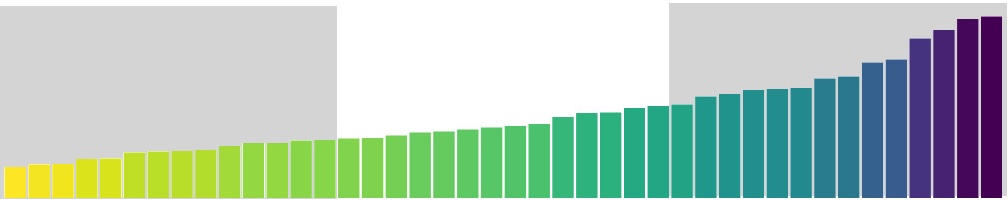
These are only based on the distribution of data values, not the range. The absolute values of indicators in different categories may not be all that different.
Active Design, Physical Activity and Health in
Port RichmondThe design and conditions of buildings, streets, public transportation and parks influence physical activity, use of active transportation and other healthy behavior. A neighborhood’s features can also impact the safety of its residents.
Injury and health
Neighborhood design can influence health both directly -- by way of immediate hazards in the environment, and indirectly, for example, by encouraging exercise.
Adults reporting a Body Mass Index over 25. People who are overweight or obese are at increased risk for heart disease and diabetes. Neighborhood factors such as walkability and the types of food retail outlets available can impact residents' risk of being overweight or obese.
Overweight in Port Richmond:
In the middle of neighborhoods
the Staten Island average
(boro val%)
the Citywide average
(city val%)
In Staten Island, it is [TREND]. Citywide, the trend is [TREND].
Source: New York City Community Health Survey (CHS)
ED visits related to bicycle injuries. Bicycle injury ED visits can indicate the overall safety of cycling in the city.
Bicycle injuries in Port Richmond:
In the middle of neighborhoods
the Staten Island average
(boro val per 100,000)
the Citywide average
(city val per 100,000)
In Staten Island, it is [TREND]. Citywide, the trend is [TREND].
Source: New York State Department of Health, Statewide Planning and Research Cooperative System (SPARCS) 2018-2021, cut by NYSDOH in November 2023.
Transportation-related ED visits for pedestrians. Pedestrian injury ED visits can indicate the safety of walking for transportation.
Pedestrian injuries in Port Richmond:
Higher than most neighborhoods
the Staten Island average
(boro val per 100,000)
the Citywide average
(city val per 100,000)
In Staten Island, it is [TREND]. Citywide, the trend is [TREND].
Source: New York State Department of Health, Statewide Planning and Research Cooperative System (SPARCS) 2018-2023, cut by NYSDOH in November 2023 (2018-2021) and October 2024 (2022-2023).
Deaths before age 65. This can indicate the overall health of a population.
Death before 65 in Port Richmond:
Higher than most neighborhoods
the Staten Island average
(boro val per 100,000)
the Citywide average
(city val per 100,000)
In Staten Island, it is [TREND]. Citywide, the trend is [TREND].
Source: New York City Bureau of Vital Statistics; New York City Bureau of Vital Statistics; United States Census
Neighborhood resources
Aspects of the neighborhood environment can encourage walking, bicycling and participation in other healthy physical activities.
The percent of a neighborhood that is shaded by trees. Tree shade can lower a neighborhood's temperature, making it more comfortable for physical activity.
Tree shade in Port Richmond:
Higher than most neighborhoods
the Staten Island average
(boro val%)
the Citywide average
(city val%)
In Staten Island, it is [TREND]. Citywide, the trend is [TREND].
Source: The Built Environment & Health Project (BEH), Columbia University
Sidewalk area percentage. Sidewalks are important for commuting, businesses, and physical activity. More sidewalk area contributes to a safer pedestrian environment, supports vibrant business districts and can foster social interaction.
Sidewalk area in Port Richmond:
Less than most neighborhoods
the Staten Island average
(boro val%)
the Citywide average
(city val%)
In Staten Island, it is [TREND]. Citywide, the trend is [TREND].
Source: The Built Environment & Health Project (BEH), Columbia University
The percentage of the population who live within walking distance to a park: a quarter-mile or less to entrances of smaller sites, such as sitting areas and playgrounds, and half-mile or less to entrances of larger parks. Increased access to green space and open space can contribute to increased levels of physical activity.
Park access in Port Richmond:
Less than most neighborhoods
the Staten Island average
(boro val%)
the Citywide average
(city val%)
In Staten Island, it is [TREND]. Citywide, the trend is [TREND].
Source: New York City Department of Parks and Recreation; New York City DOHMH population estimates, modified from US Census Bureau inter-censal population estimates
Percent of street milage with bike lanes. Bike lanes can improve bicyclist and pedestrian safety, physical activity, and sustainable transportation use.
Bike lanes in Port Richmond:
Less than most neighborhoods
the Staten Island average
(boro val%)
the Citywide average
(city val%)
In Staten Island, it is [TREND]. Citywide, the trend is [TREND].
Source: New York City Department of Transportation
The percentage of population within a quarter-mile of a subway station entrance. When more people have convenient access to the transit system, they're more likely to use it. Subway access encourages active transportation, which improves the health of residents.
Subway access in Port Richmond:
Less than most neighborhoods
the Staten Island average
(boro val%)
the Citywide average
(city val%)
In Staten Island, it is [TREND]. Citywide, the trend is [TREND].
Source: United States Census; Metropolitan Transportation Authority
Neighborhood risk factors
Living in high-poverty neighborhoods or in environments that feel unsafe makes it difficult to be physically active and access resources that promote health.
Mice and rats are a source of household allergens connected to developing or worsening asthma.
Mice or rats (outside) in Port Richmond:
In the middle of neighborhoods
the Staten Island average
(boro val%)
the Citywide average
(city val%)
In Staten Island, it is [TREND]. Citywide, the trend is [TREND].
Source: New York City Community Health Survey (CHS)
Households with incomes below the federal poverty level. Households without sufficient resources are often deprived of access to health care, good quality housing, and other resources that protect health.
Poverty in Port Richmond:
In the middle of neighborhoods
the Staten Island average
(boro val%)
the Citywide average
(city val%)
In Staten Island, it is [TREND]. Citywide, the trend is [TREND].
Source: American Community Survey
Adults reporting their neighborhood is safe from crime. Whether people perceive their neighborhood as safe can affect whether they will spend time outside, use parks, and use active and sustainable forms of transportation. It can also affect mental well-being.
Neighborhood safety in Port Richmond:
Less than most neighborhoods
the Staten Island average
(boro val%)
the Citywide average
(city val%)
In Staten Island, it is [TREND]. Citywide, the trend is [TREND].
Source: New York City Community Health Survey (CHS)
Physical activity
Walking and bicycling are healthy activities that can also be used for active transportation.
Adults reporting having ridden a bicycle at least once a month in the past year.
Regular biking in Port Richmond:
Less than most neighborhoods
the Staten Island average
(boro val%)
the Citywide average
(city val%)
In Staten Island, it is [TREND]. Citywide, the trend is [TREND].
Source: New York City Community Health Survey (CHS)
Adults reporting exercise in the past 30 days (from when they were surveyed). Regular exercise is a key way to stay healthy.
Exercise in Port Richmond:
Less than most neighborhoods
the Staten Island average
(boro val%)
the Citywide average
(city val%)
In Staten Island, it is [TREND]. Citywide, the trend is [TREND].
Source: New York City Community Health Survey (CHS)
View this report online: