Climate and Health in
Southeast Queens| Metric | Value |
|---|---|
| Population | XX,XXX |
| Over age 65 | YY% |
| Under age 18 | YY% |
| Poverty | YY% |
| Graduated high school | YY% |
| Limited English | YY% |
| Owner-occupied homes | YY% |
| Rent-burdened households | YY% |
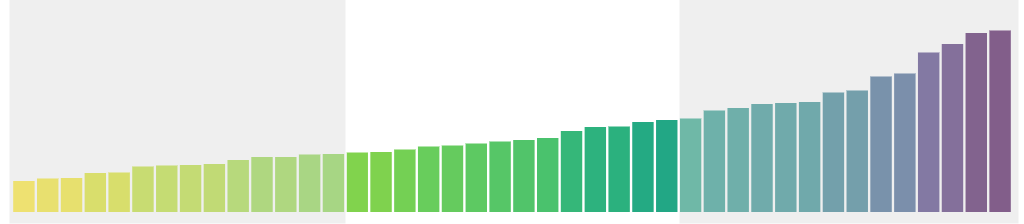
For each dataset, we divide neighborhoods up into tertiles, or thirds. This provides a rough comparison of this neighborhood, to all other NYC neighborhoods, for this indicator.
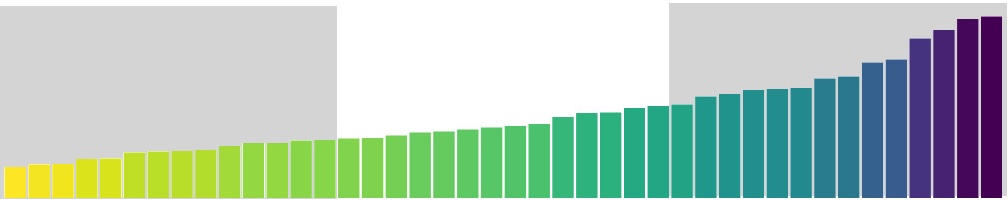
These are only based on the distribution of data values, not the range. The absolute values of indicators in different categories may not be all that different.
Climate and Health in
Southeast QueensAs the climate changes, we track New York City’s risk for extreme heat, storms and flooding, and episodes of elevated ozone. These have important public health impacts: already, heat kills more people than all other natural disasters.
Climate hazards
Some neighborhoods are hotter than others, which can make it costly or difficult to stay healthy for those residents
Hurricane Evacuation Zones are determined by New York City Emergency Management and indicate varying threat levels of coastal flooding from storm surge. Evacuation orders may be given during hurricanes or coastal flooding events. There are six zones, ranked by storm surge risk. Zone 1 is the highest risk for flooding. Residents in these zones may receive evacuation orders during hurricanes or tropical storms.
Coastal flood risk in Southeast Queens:
In the middle of neighborhoods
the Queens average
(boro val%)
the Citywide average
(city val%)
In Queens, it is [TREND]. Citywide, the trend is [TREND].
Source: New York City Office of Emergency Management
Spatial average of surface temperature, measured by satellite. Surface temperatures vary because of vegetative cover (which promotes cooling), and paved roads, sidewalks, and buildings (which retain heat). Hotter neighborhoods tend to have more heat-exacerbated deaths associated with extreme heat events.
Surface temperature in Southeast Queens:
Higher than most neighborhoods
the Queens average
(boro val )
the Citywide average
(city val )
In Queens, it is [TREND]. Citywide, the trend is [TREND].
Source: U.S. Geological Survey
Health outcomes
Health outcomes that can be affected by conditions in the home or neighborhood.
Emergency department visits for asthma. Things like smoke, air pollution, dust mites, cockroaches, mold, pollen and pet dander can trigger asthma.
Asthma ED visits (age 5 to 17) in Southeast Queens:
In the middle of neighborhoods
the Queens average
(boro val per 10,000)
the Citywide average
(city val per 10,000)
In Queens, it is [TREND]. Citywide, the trend is [TREND].
Source: New York State Statewide Planning and Research Cooperative System (SPARCS) Deidentified Hospital Discharge Data
Built environment
Access to AC, green space, and well-insulated homes can effect how easy it is to stay cool.
Land covered by trees, grass, or other plants. Vegetative cover reduces temperatures in the immediate area, and may increase air quality.
Grass and tree cover in Southeast Queens:
Higher than most neighborhoods
the Queens average
(boro val%)
the Citywide average
(city val%)
In Queens, it is [TREND]. Citywide, the trend is [TREND].
Source: University of Vermont remote sensing LiDAR data, assessed using methodology described in: MacFaden, S.W., O'Neil-Dunne, J.P.M., Royer, A.R., Lu, J.W.T., & Rundle, A.G. (2012). High-resolution tree canopy mapping for New York City using LiDAR and object-based image analysis. Journal of Applied Remote Sensing, 6(1).
Building quality predicts the number of housing maintenance problems in a residence that place residents at increased risk of acute or chronic health problems.
Neighborhood building quality in Southeast Queens:
In the middle of neighborhoods
the Queens average
(boro val%)
the Citywide average
(city val%)
In Queens, it is [TREND]. Citywide, the trend is [TREND].
Source: New York City Housing and Vacancy Survey (NYCHVS)
Older adults (over 65) are more vulnerable to hot weather and heat stress. Air conditioning reduces the risk of heat stroke and other heat-related illness.
Older adults with AC in Southeast Queens:
the Queens average
(boro val%)
the Citywide average
(city val%)
In Queens, it is [TREND]. Citywide, the trend is [TREND].
Source: New York City Community Health Survey (CHS)
Priority populations
Some populations may be more vulnerable to health outcomes associated with climate.
Households with incomes below the federal poverty level. Households without sufficient resources are often deprived of access to health care, good quality housing, and other resources that protect health.
Poverty in Southeast Queens:
Less than most neighborhoods
the Queens average
(boro val%)
the Citywide average
(city val%)
In Queens, it is [TREND]. Citywide, the trend is [TREND].
Source: American Community Survey
Mental health conditions like series psychological distress can be worsened by extreme weather such as heat waves and coastal storms.
Psychological distress in Southeast Queens:
Less than most neighborhoods
the Queens average
(boro val%)
the Citywide average
(city val%)
In Queens, it is [TREND]. Citywide, the trend is [TREND].
Source: New York City Community Health Survey (CHS)
People age 65+ living alone. People living alone may have more difficulty getting resources they need in an emergency, and are at higher risk of weather-related illnesses like heat stroke and hypothermia.
Older adults living alone (65+) in Southeast Queens:
Less than most neighborhoods
the Queens average
(boro val%)
the Citywide average
(city val%)
In Queens, it is [TREND]. Citywide, the trend is [TREND].
Source: American Community Survey
Adults reporting independent living difficulty due to a physical, mental, or emotional problem. People with disabilities may need additional support during extreme weather. For example, extra planning for safe travel out of evacuation zones during a hurricane, or back-up electricity to support medical equipment during power outages.
Independence difficulty in Southeast Queens:
In the middle of neighborhoods
the Queens average
(boro val%)
the Citywide average
(city val%)
In Queens, it is [TREND]. Citywide, the trend is [TREND].
Source: American Community Survey
View this report online: