Environments matter: the road to street safety in NYC
The COVID-19 public health emergency has changed New York City in many ways—including how we get around the city. As the city continues to adapt to COVID-19, New Yorkers will look for ways to get around that feel safe—redistributing transit among different modes to ease crowding and increase safety on public transportation.
As more New Yorkers use bicycles, let’s take a look at safety on our streets.
Cyclist safety in public health data
New York City’s streets offer opportunities for active transportation, like cycling and walking, but can also pose risks from collisions. We had a stark reminder of that in 2019, when 28 cyclists died on NYC streets, following an historic low of 10 in 2018.
We can look at data to understand how to maximize health promotion and minimize risk. Public health data include hospitalization and emergency department (ED) data, which track injuries to cyclists as well as pedestrians. Along with these injury statistics, we have data on traffic density (e.g., measured in vehicle miles traveled on specific roads), infrastructure (e.g., the presence of bike lanes), and cycling (e.g., how many people regularly bicycle to get around).
When we look at these data together, a “safety in numbers” story emerges: the more extensive the infrastructure and the more people riding bicycles, the safer streets are as an environment for physical activity. Let’s take a closer look.
Disparities in NYC’s traffic-related injuries
When we look at data on traffic-related injuries by borough in New York City, Brooklyn and Queens show higher rates of hospitalization and ED visits, with Manhattan showing notably lower rates.
Brooklyn has a higher rate of cyclist injury ED visits and hospitalizations than both Manhattan and the citywide averages.
One might expect cycling to carry higher injury risk in areas with more traffic and with more cyclists. The map below shows neighborhoods with high, medium, and low traffic density - measured in vehicle miles travelled.
Overall, despite Manhattan having higher traffic density than Brooklyn, it has lower rates of cyclist ED visits and hospitalizations. This is intuitive, actually - denser traffic means slower speeds, resulting in safer streets for cyclists.
Now let’s look at the number of cyclists on NYC streets. When we map cycling in New York City, we see a slightly larger percentage of Manhattan adults bicycle at least monthly (19.5%), compared to Brooklyn adults (17.3%).
So neither more cars nor more cyclists necessarily means more injuries to cyclists.
The role of environmental factors
In public health, we don’t just look at the influence of health behaviors (e.g., riding a bicycle or driving) on health outcomes (e.g., injuries). We also examine environmental factors - any characteristics of the world around us that can affect our health and our behavior.
Bicycle network coverage may be a factor influencing NYC injury rates.
In Manhattan, nearly 30 percent of streets have bike lanes—but in Brooklyn, only 13 percent of streets do. This is consistent with research that shows that bicycle networks offer protection to people on the streets.
Safety in numbers
The idea of “safety in numbers” comes from a study that found that “a motorist is less likely to collide with a person walking and bicycling if more people walk or bicycle.” This is probably because as the number of people walking and cycling increases, motorists become more attentive. So as the number of cyclists rises, we expect to see injury rates go down.
Ongoing work to promote cycling will help lower injury rates. Expanding bike share networks, increasing bicycle network coverage, and continuing to build protective street environments—like separated bike lanes—can get more riders on the street and offer them greater protection.
This effect is apparent when we look at differences between Manhattan and Brooklyn—and apply what we learn throughout the city. Disparities in cycling by sex, race/ethnicity, age, and neighborhood poverty also need to be addressed through equitably focused safety improvements, since safety in numbers works best if we increase safety for everyone—starting where it is most needed.
As New York City continues to grapple with the COVID-19 pandemic, many New Yorkers may turn to biking as a good way to get around while still keeping a safe distance from others. Our data show us that there is a clear connection between road infrastructure and street safety. That means that one way to keep New Yorkers safe during this public health emergency—and beyond—is to continue building safer streets.
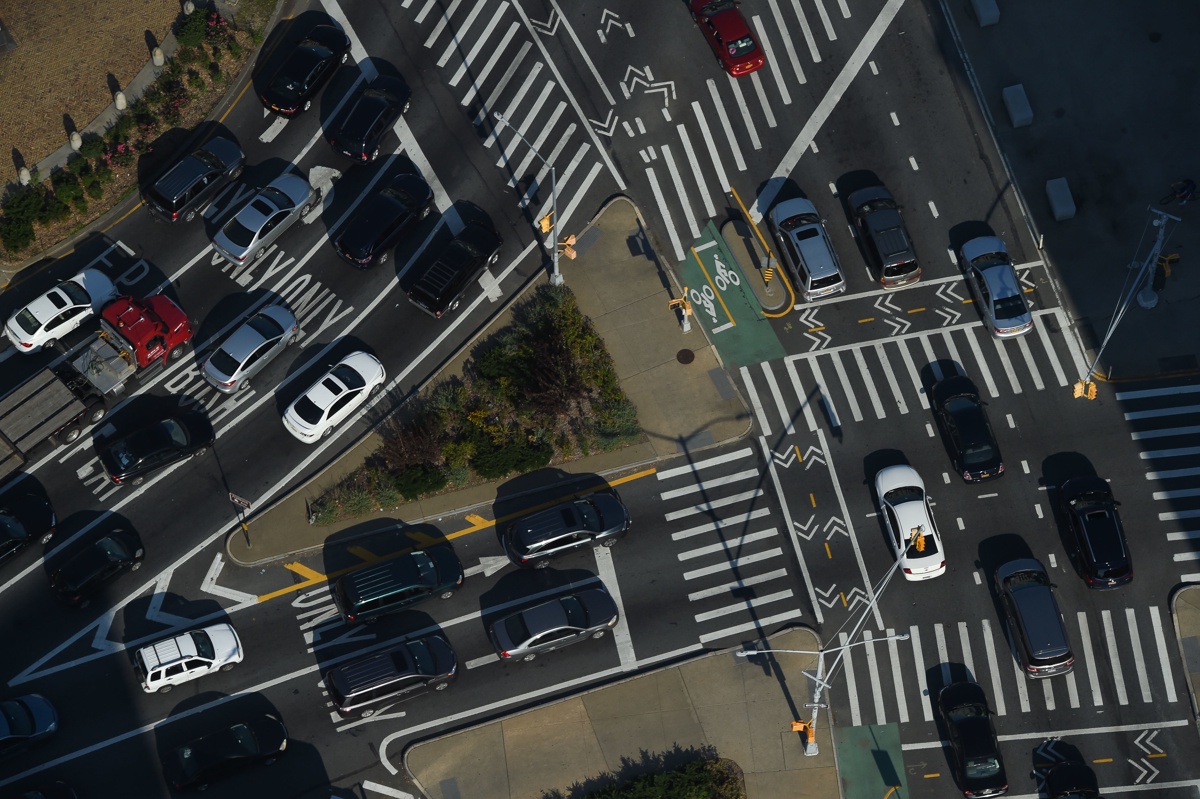
Michael Appleton/Mayoral Photography Office, City of New York
Published on:
September 20, 2020