ZAPPA: A tool to understand air quality policies
New York City’s air quality is generally good and has been improving over time. Still, air pollution threatens health: two pollutants, ozone and PM2.5 cause about 2,400 deaths per year in NYC, and thousands more emergency department visits and hospitalizations for asthma, heart, and lung problems.
It’s important to clean up the air to protect New Yorkers, and we know how to do it: reduce emissions from buildings, vehicles, restaurants, power plants, and other sources of pollutants.
But how can New Yorkers decide which air quality policies to push for? How can we know what changes will have the greatest benefits?
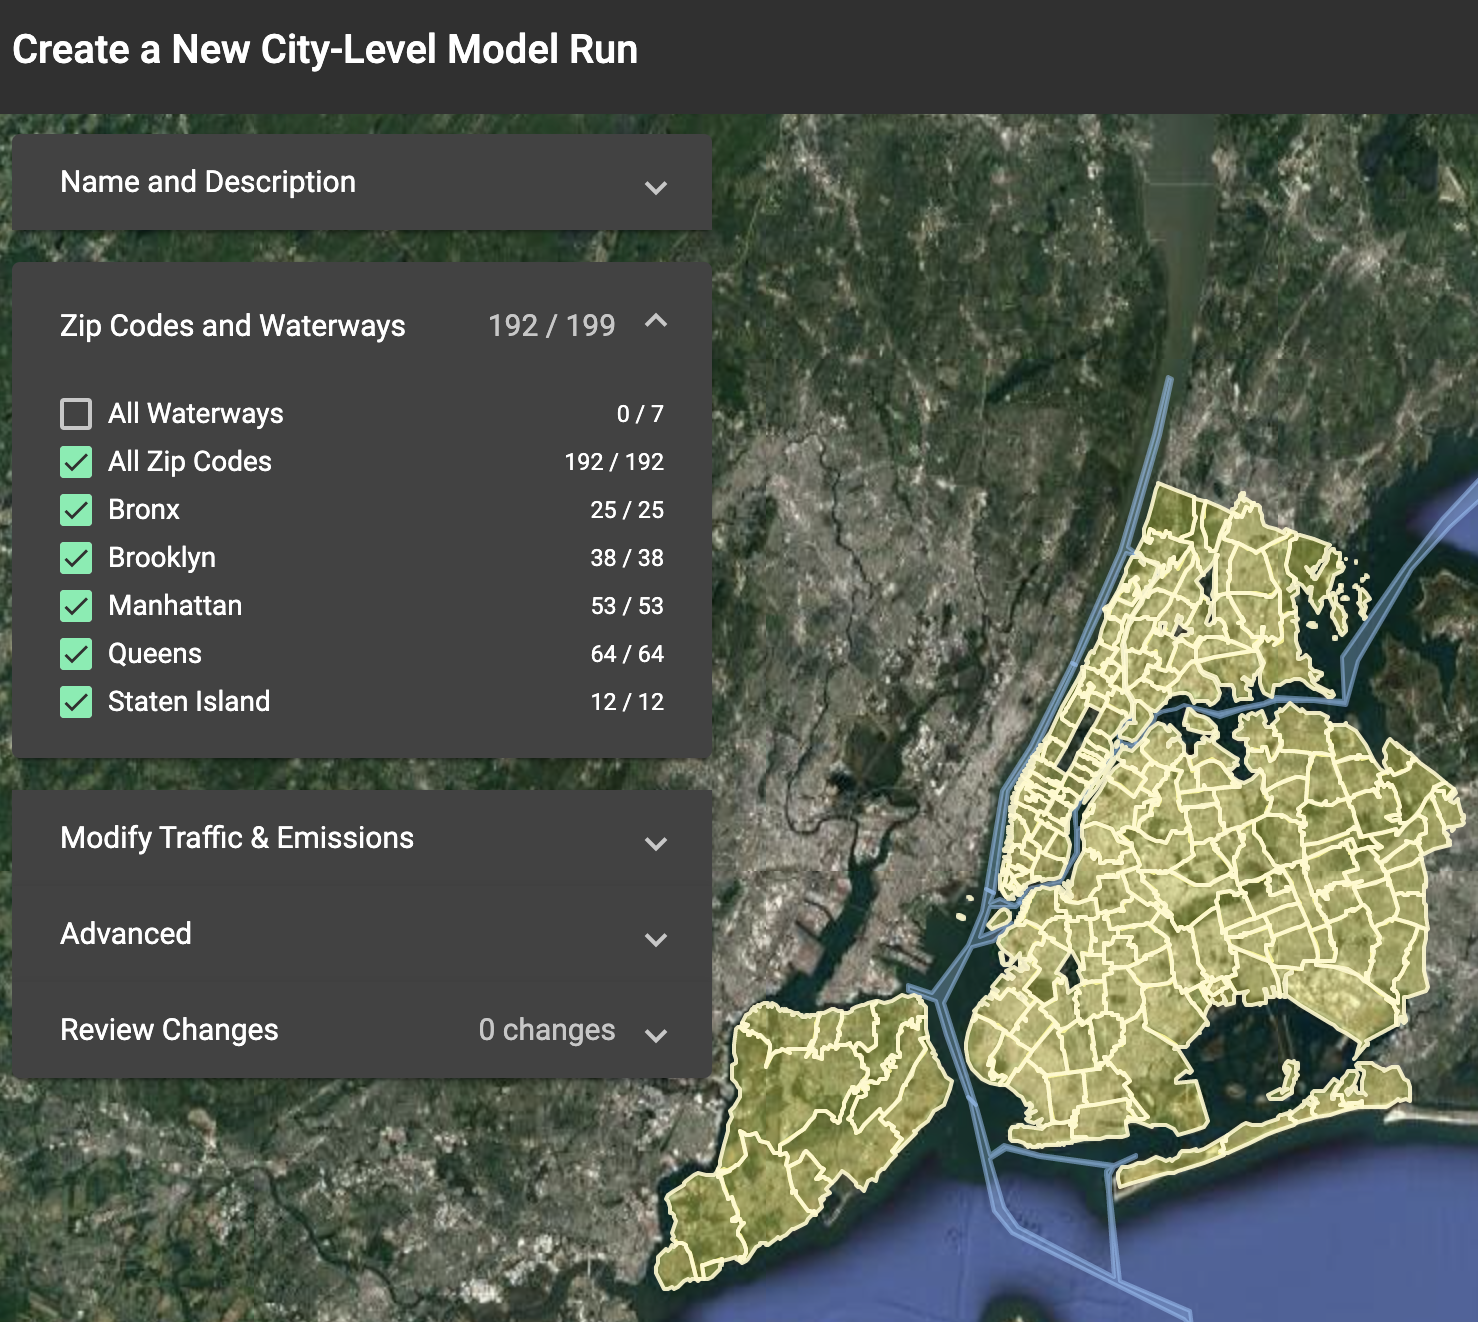
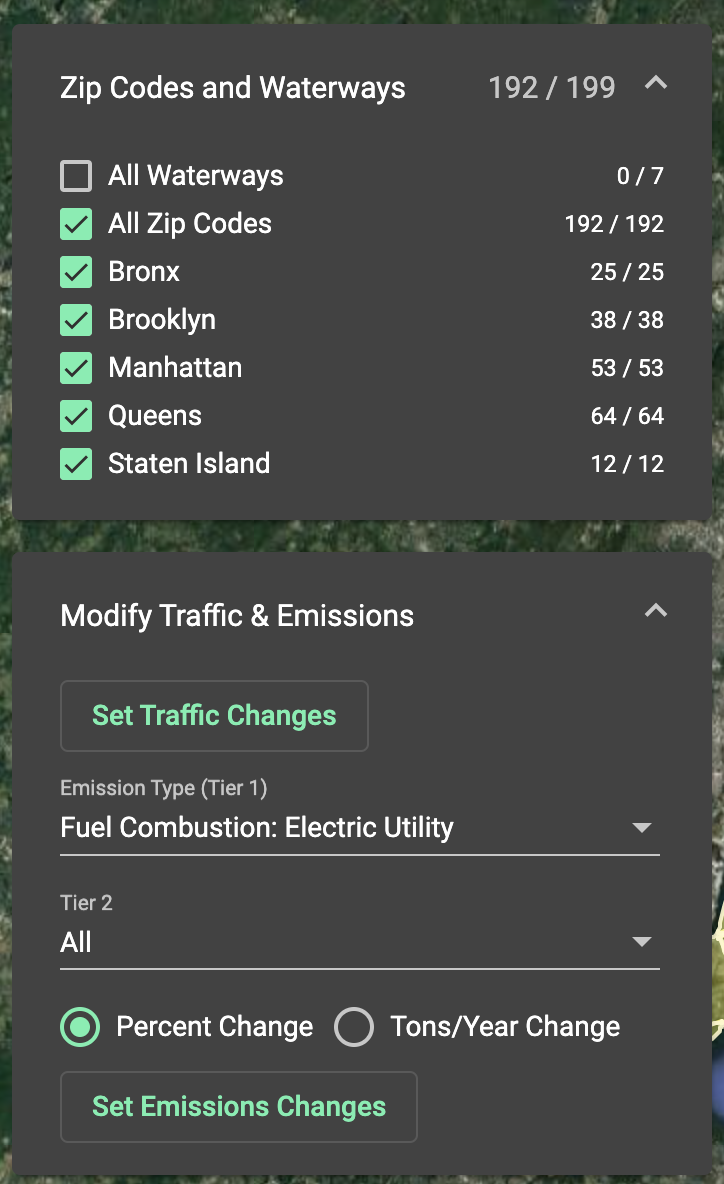
To help answer these questions, the Health Department developed ZAPPA — the ZIP Code Air Pollution Policy Assessment — a free, online tool that that uses emissions data and atmospheric chemistry models to predict the effects of different policy proposals to reduce emissions.
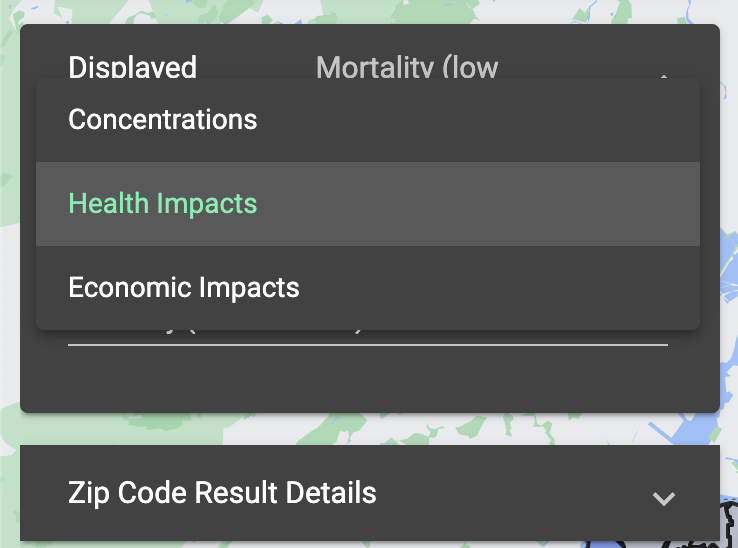
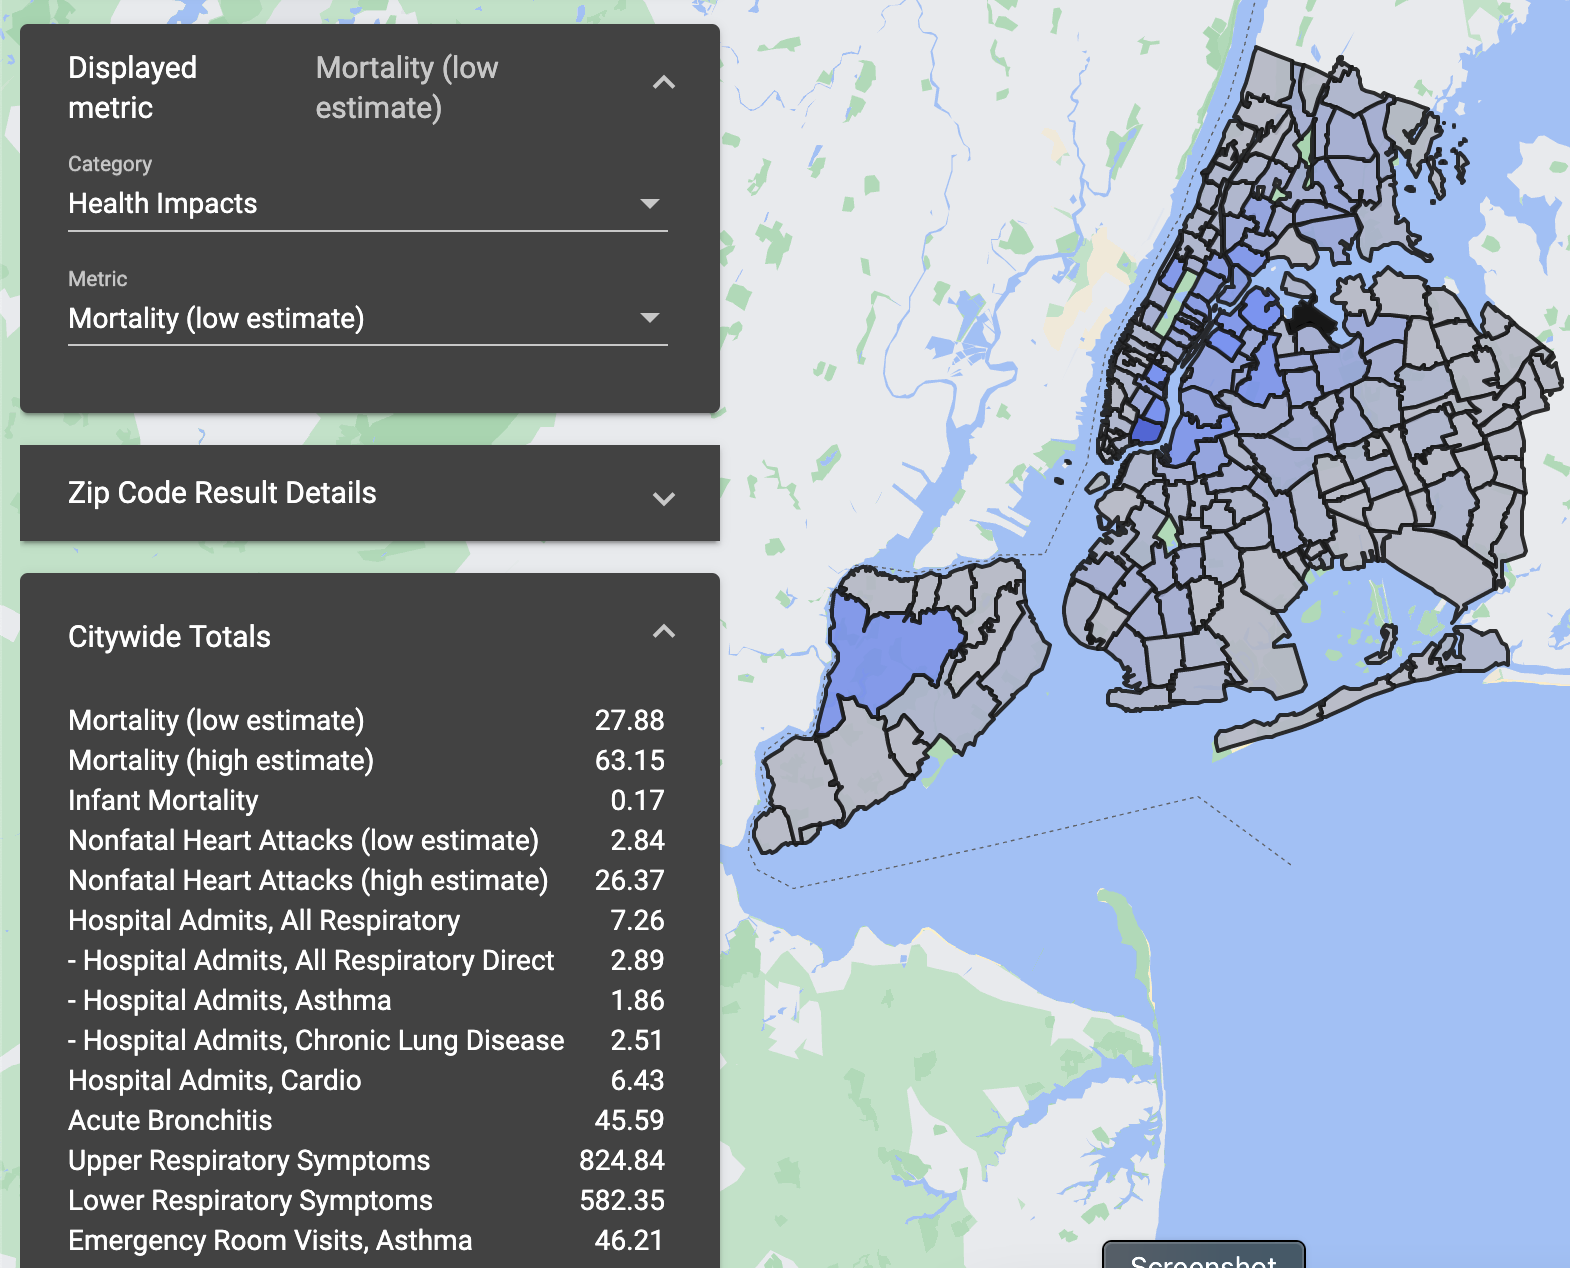
Planners, advocates, scientists and others can use ZAPPA to see how proposed policy changes would affect air pollution, health outcomes, and costs, including at the neighborhood level.
Let’s try it.
Modelling different scenarios using ZAPPA
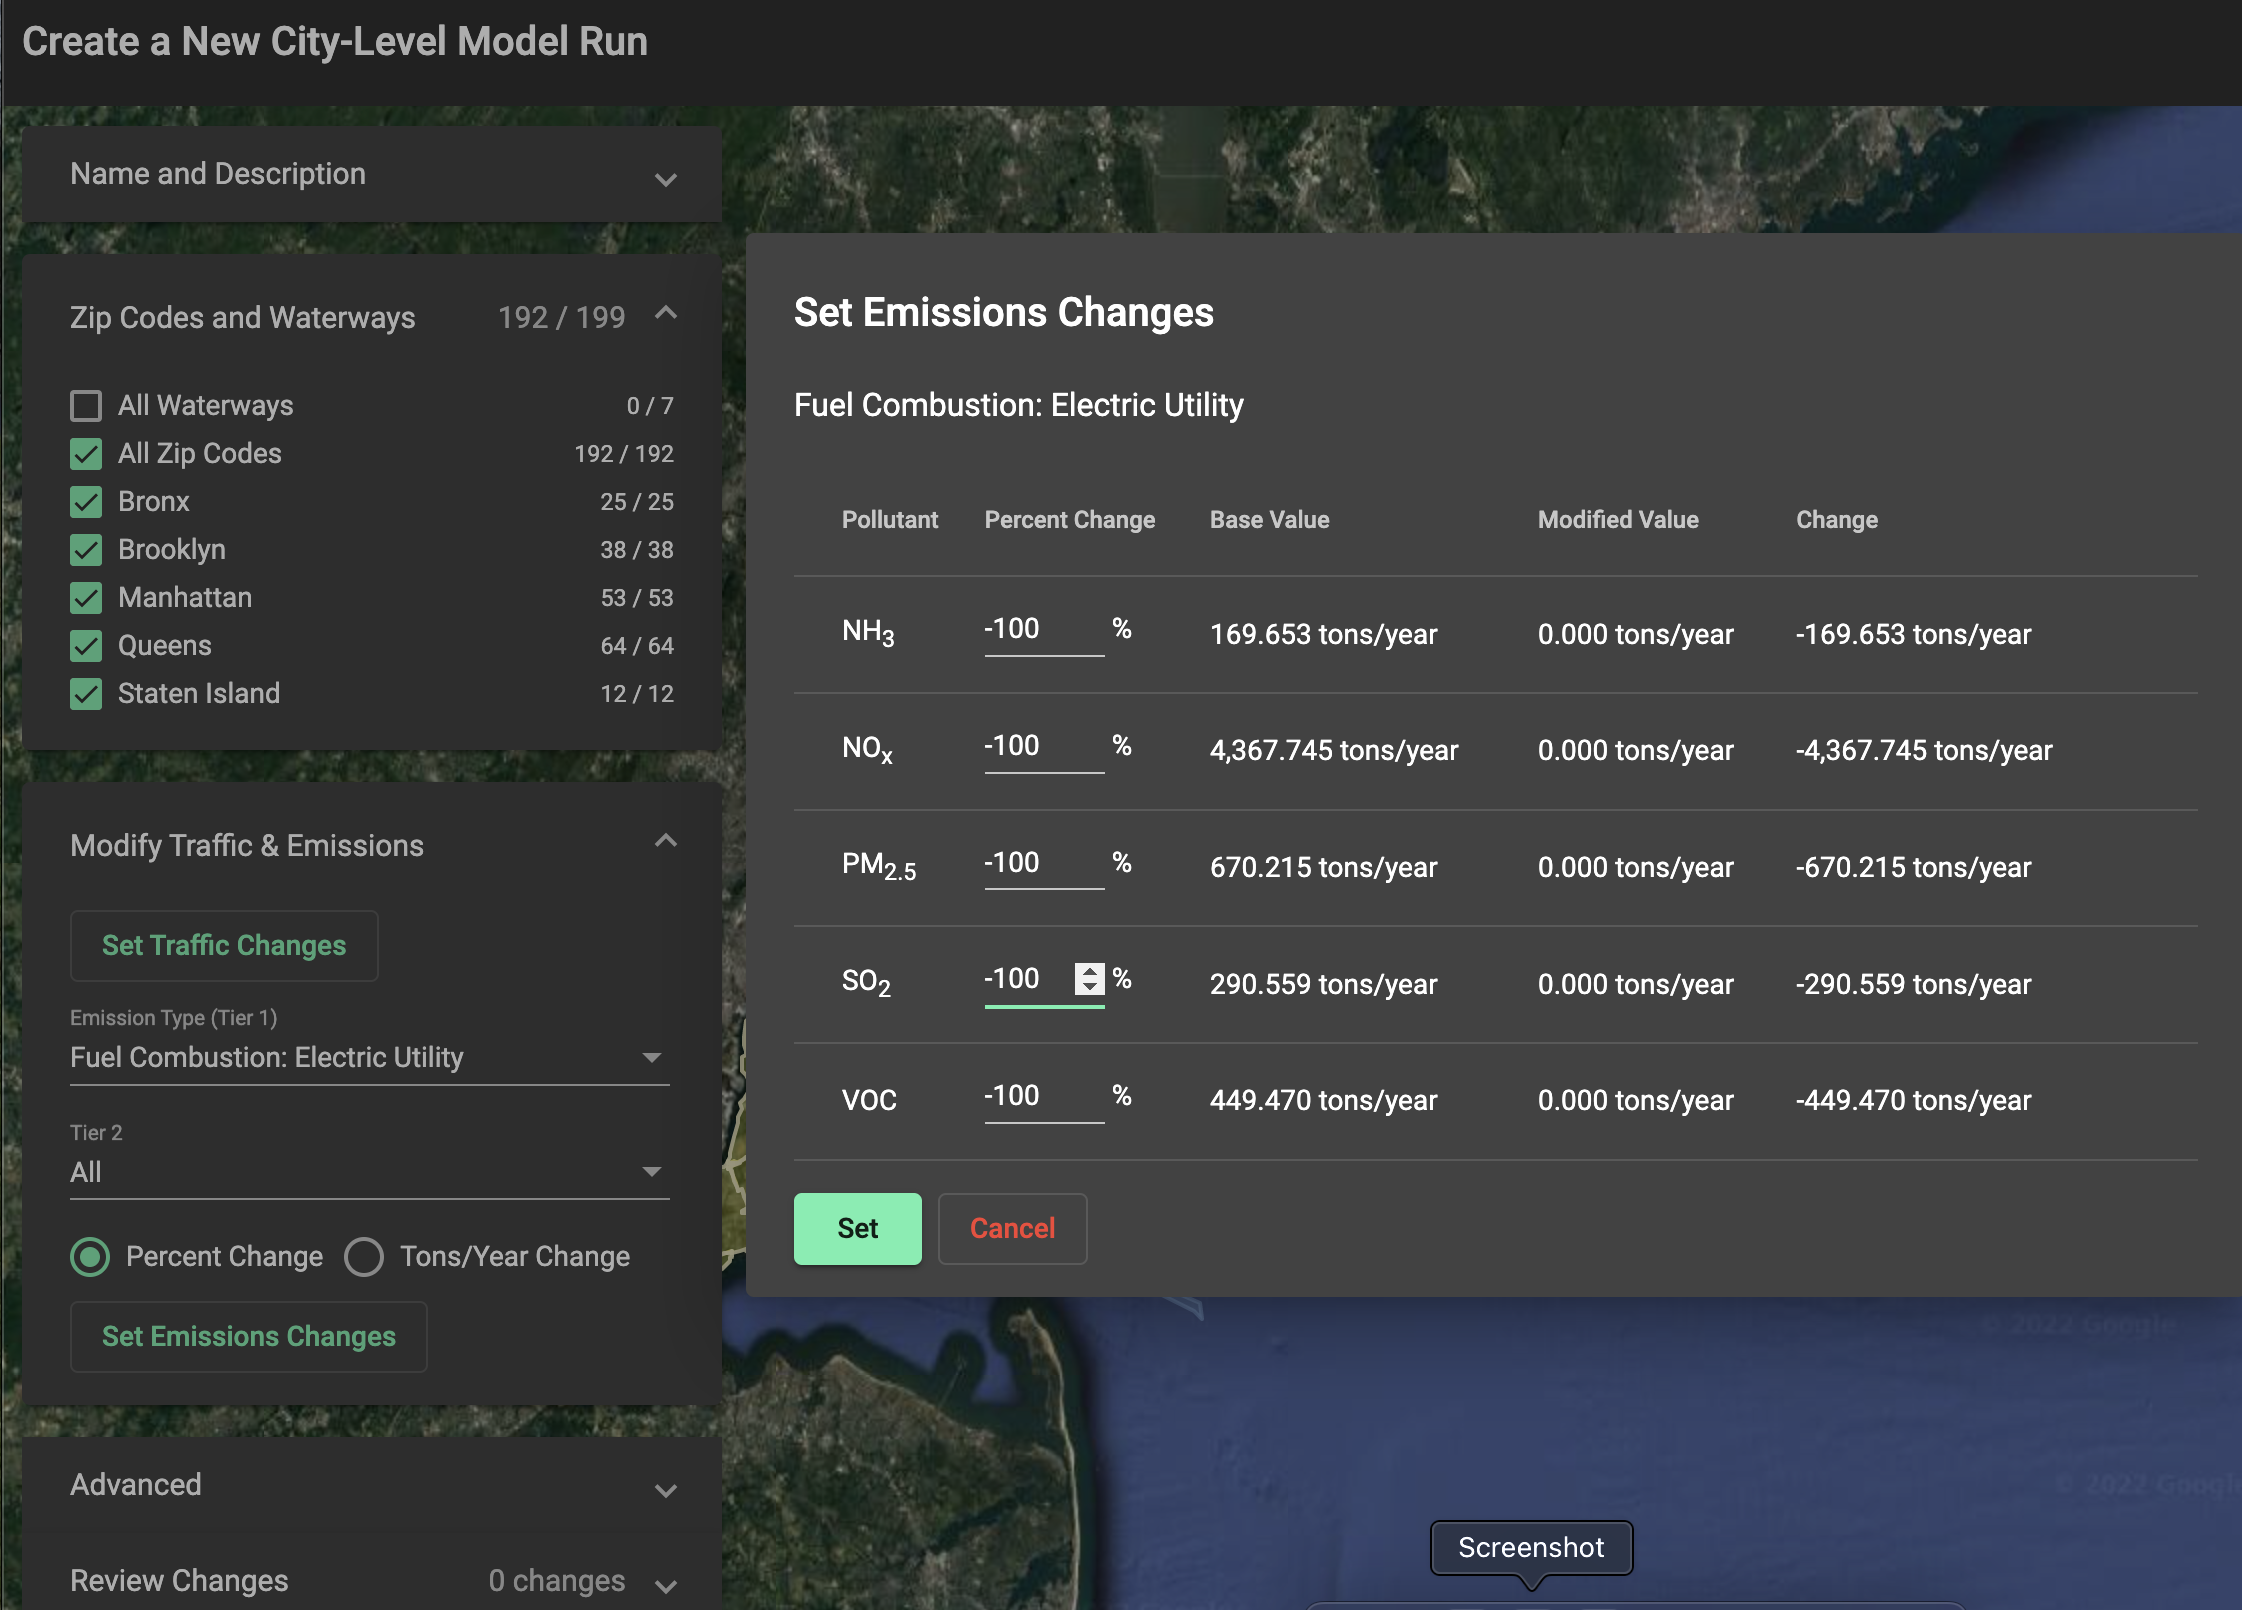
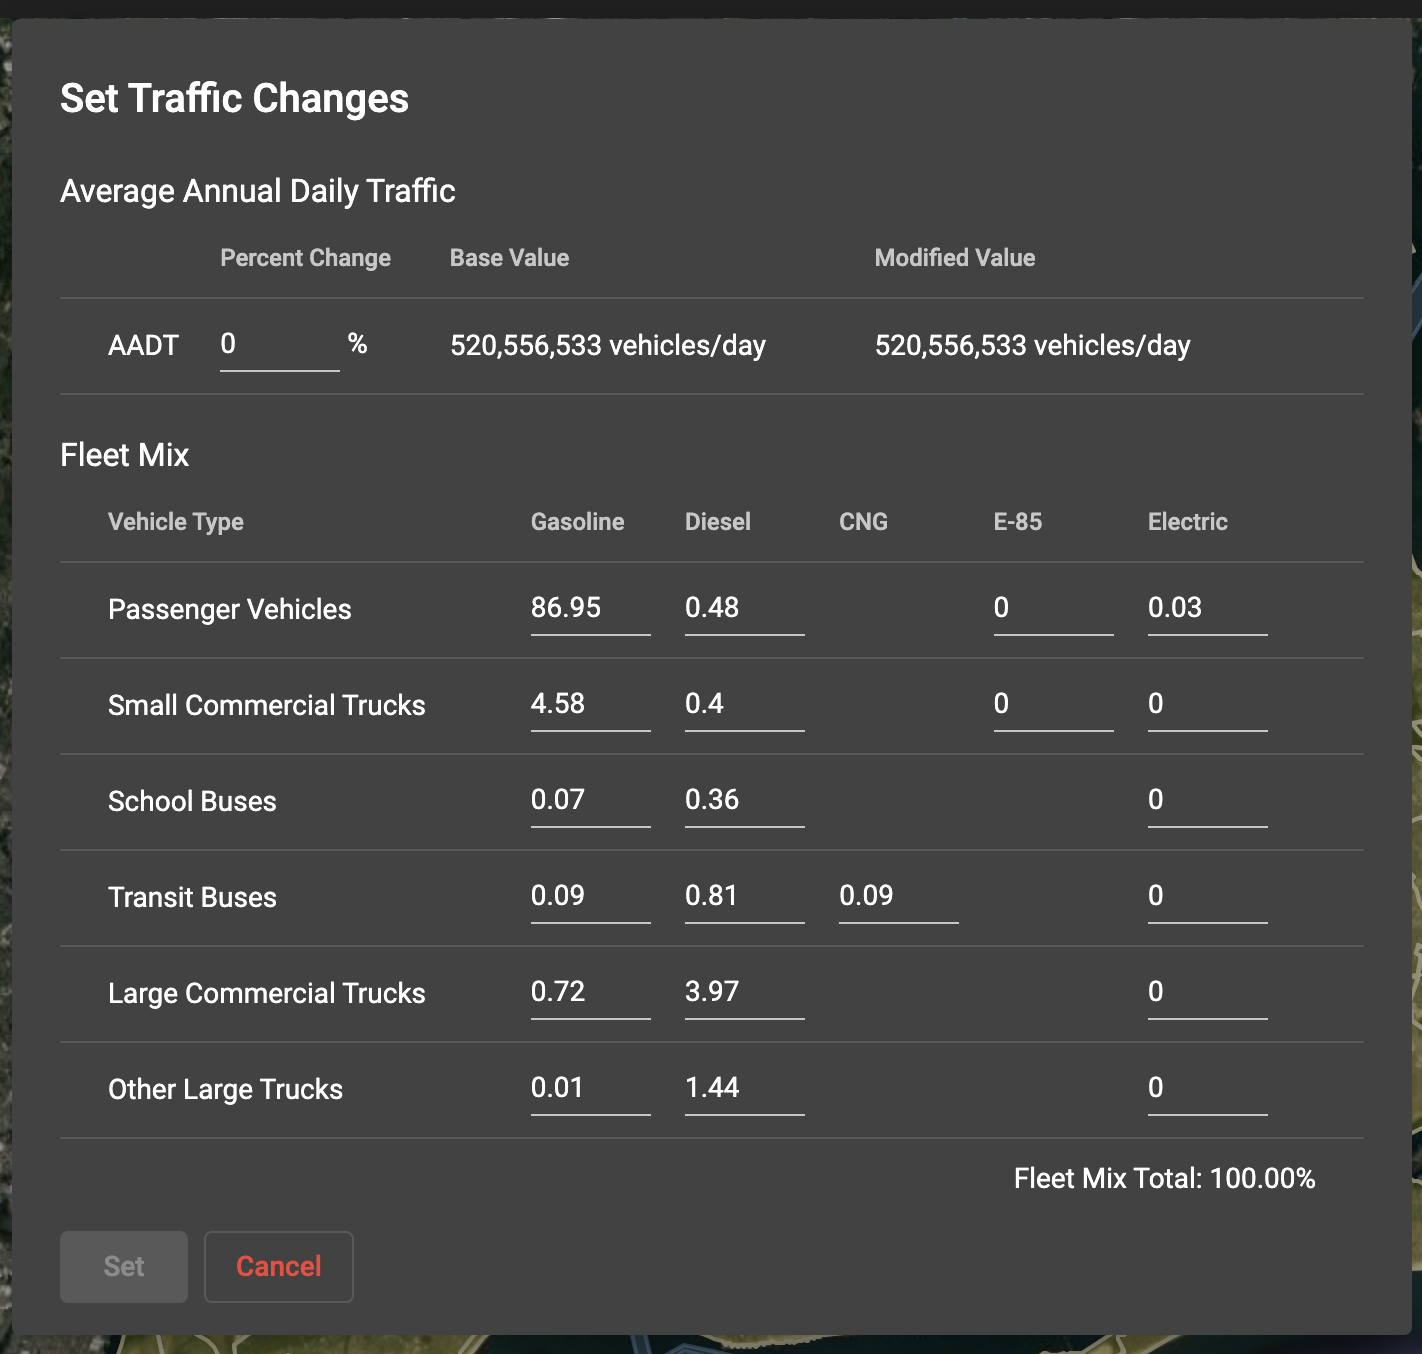
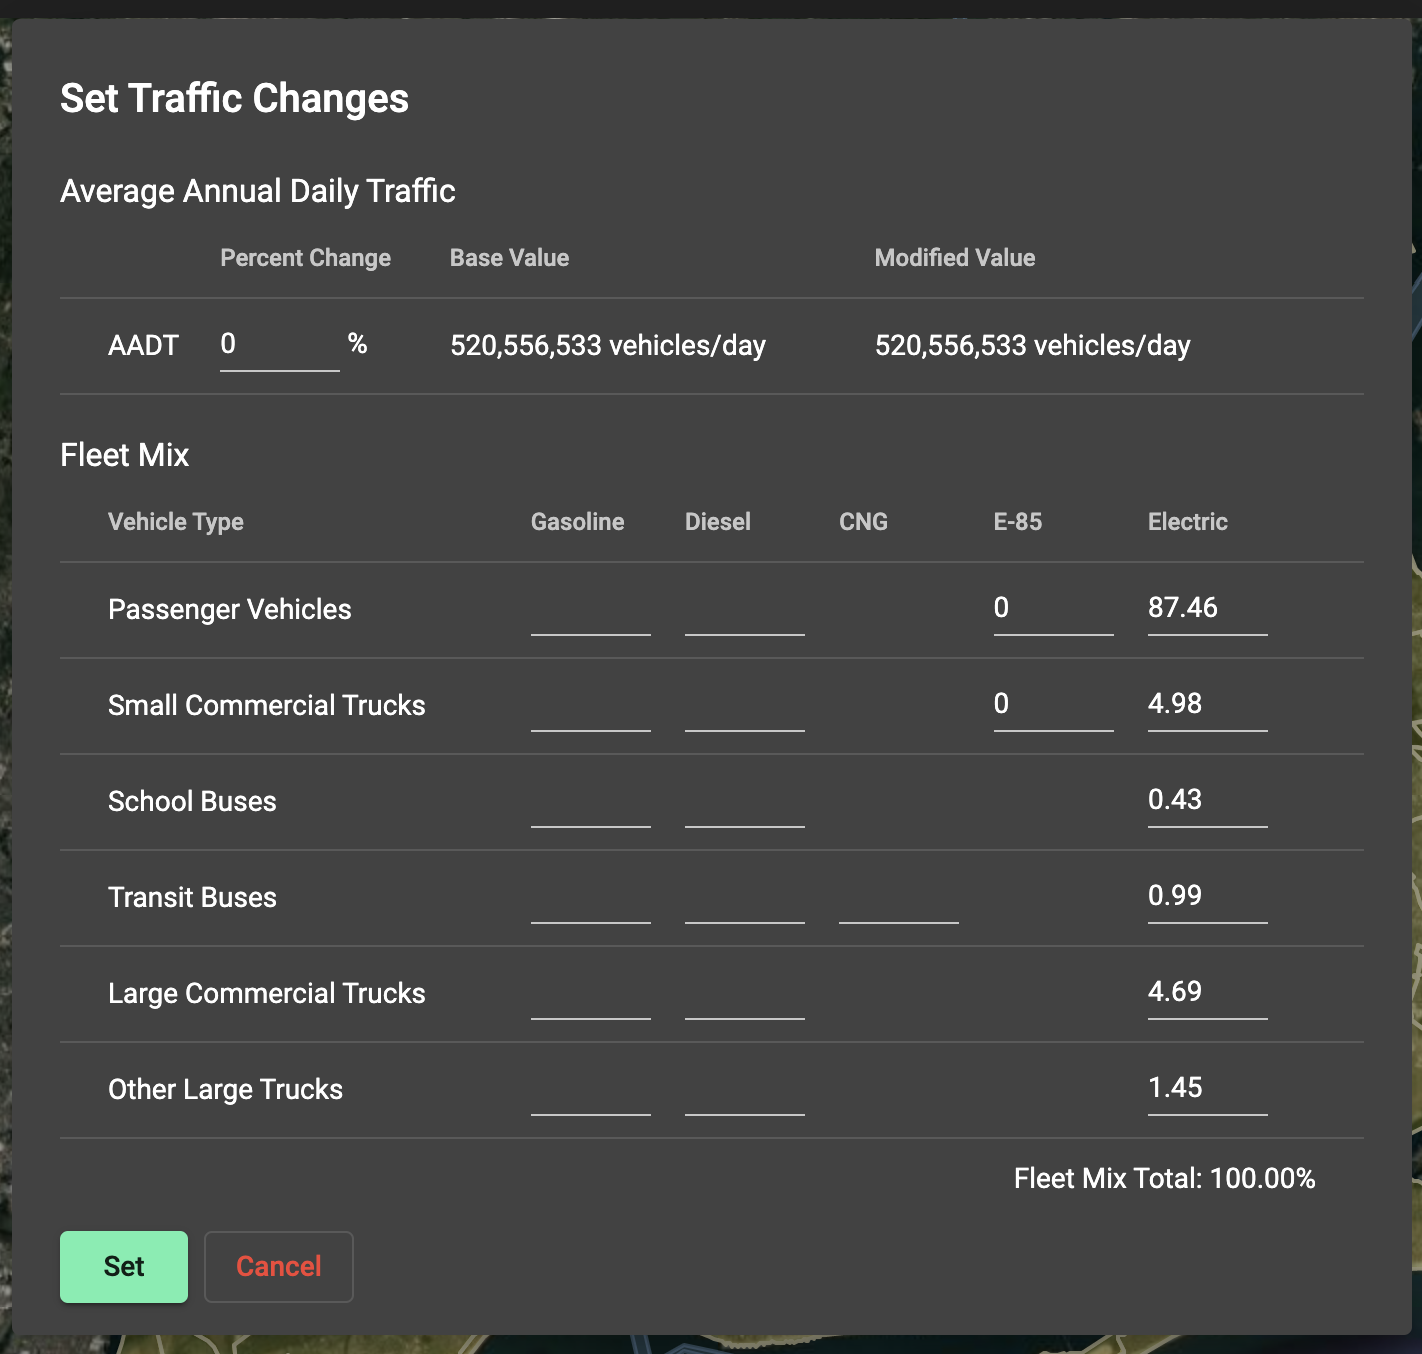
Scenario 1: What if we eliminated electric power generation in NYC?
Some New Yorkers advocate closing all power plants in NYC and relying only on renewable energy sources like hydro, wind, or solar power. What does ZAPPA tell us about the impact of such a proposal?
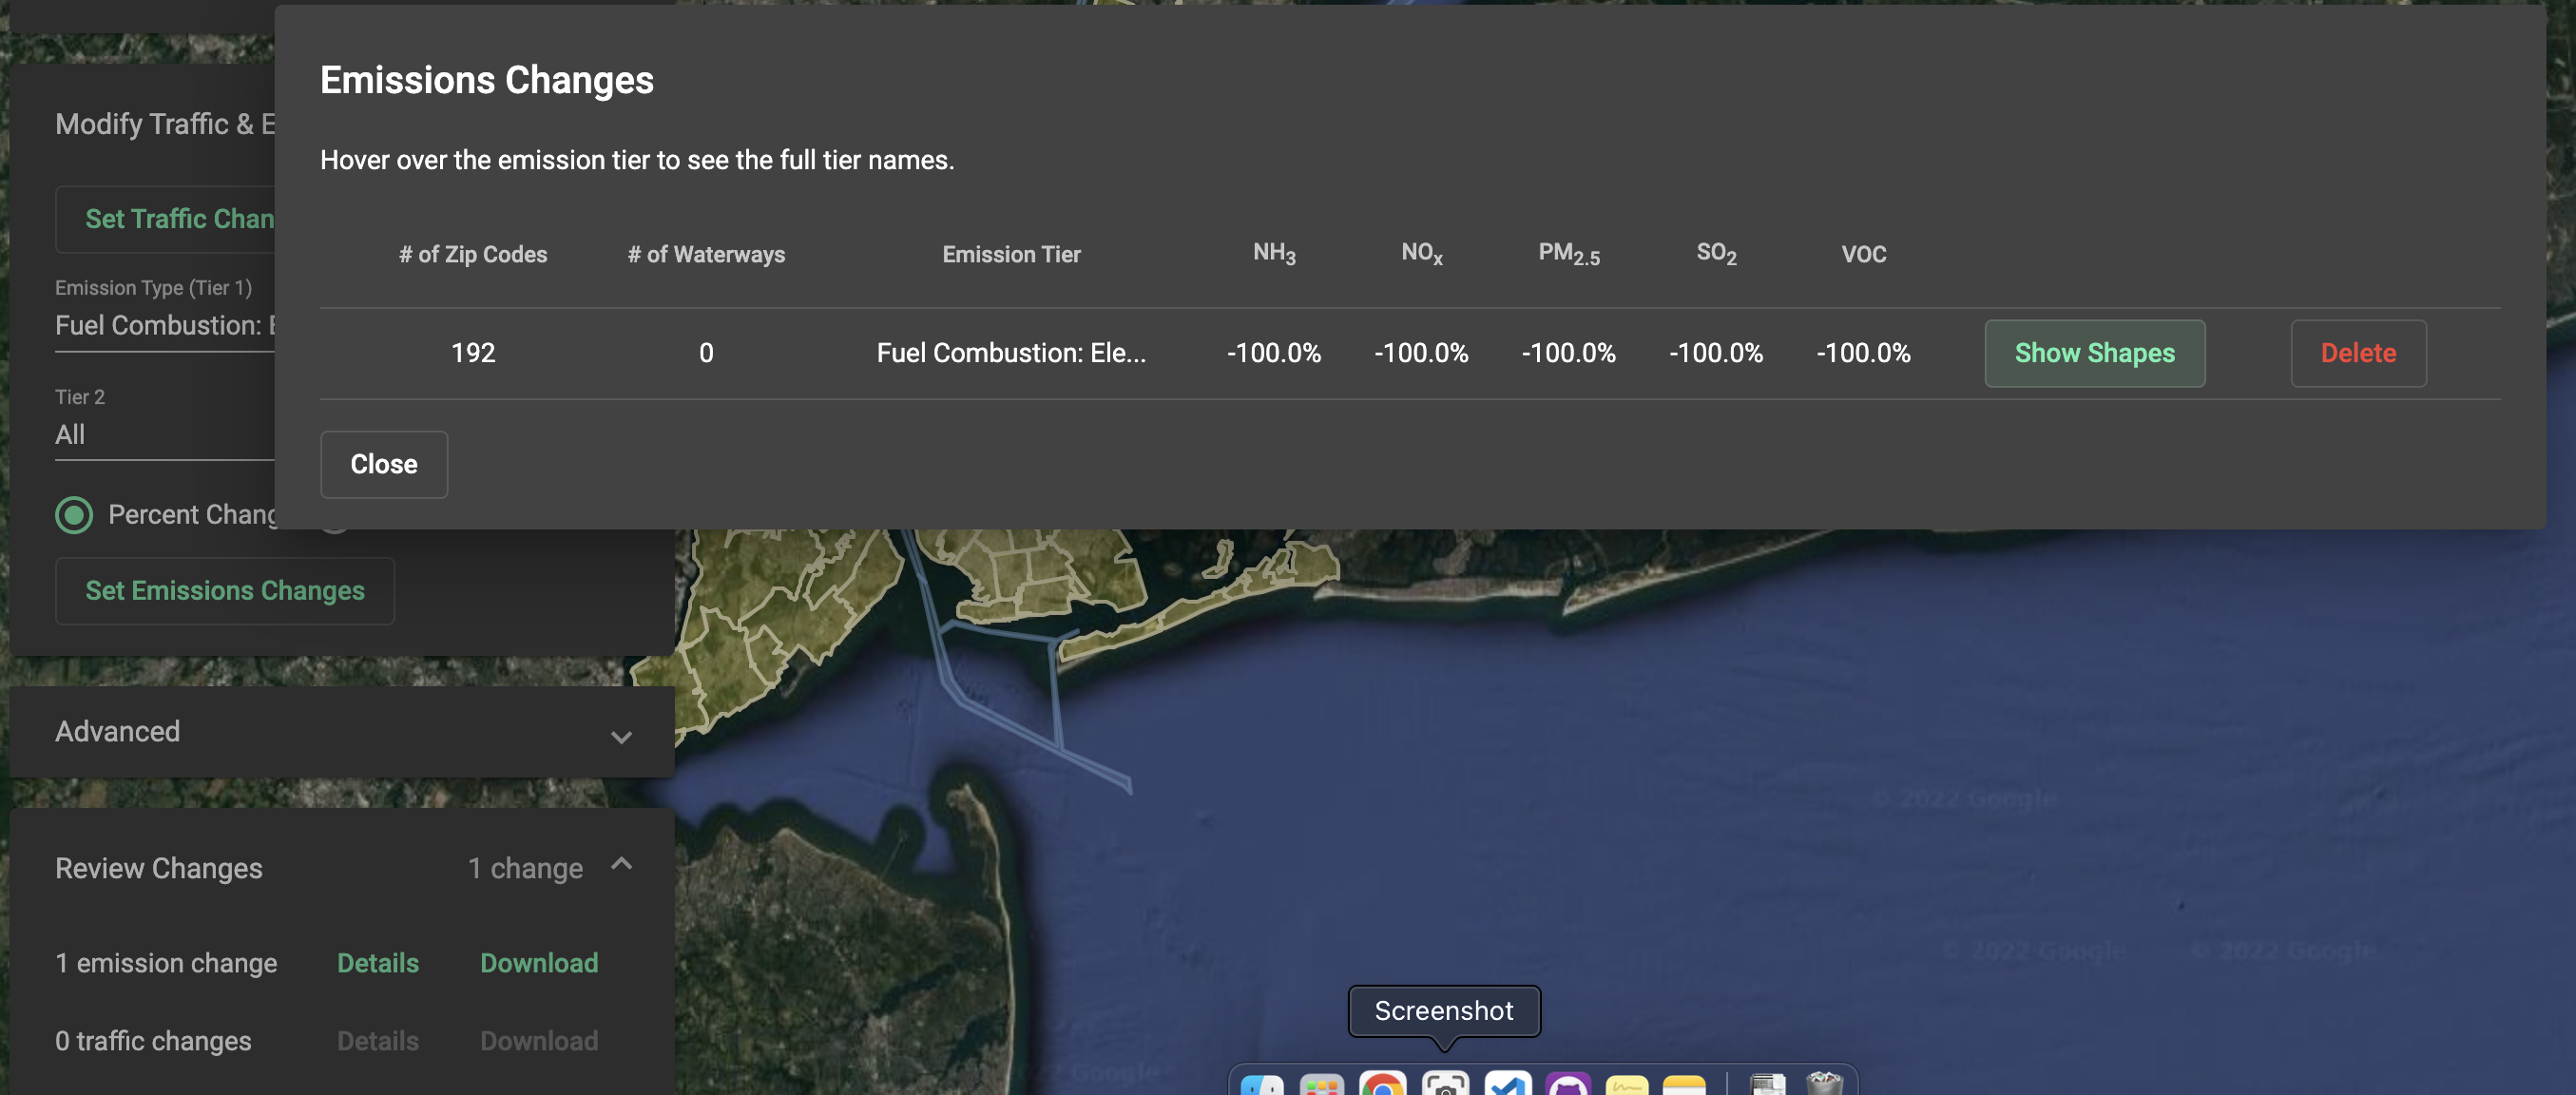
Generating electricity releases pollutants like nitrogen oxides and sulfur dioxide, which help create PM2.5. Many of New York City’s power plants are “peaker plants” that are only activated at times of high electricity demand.
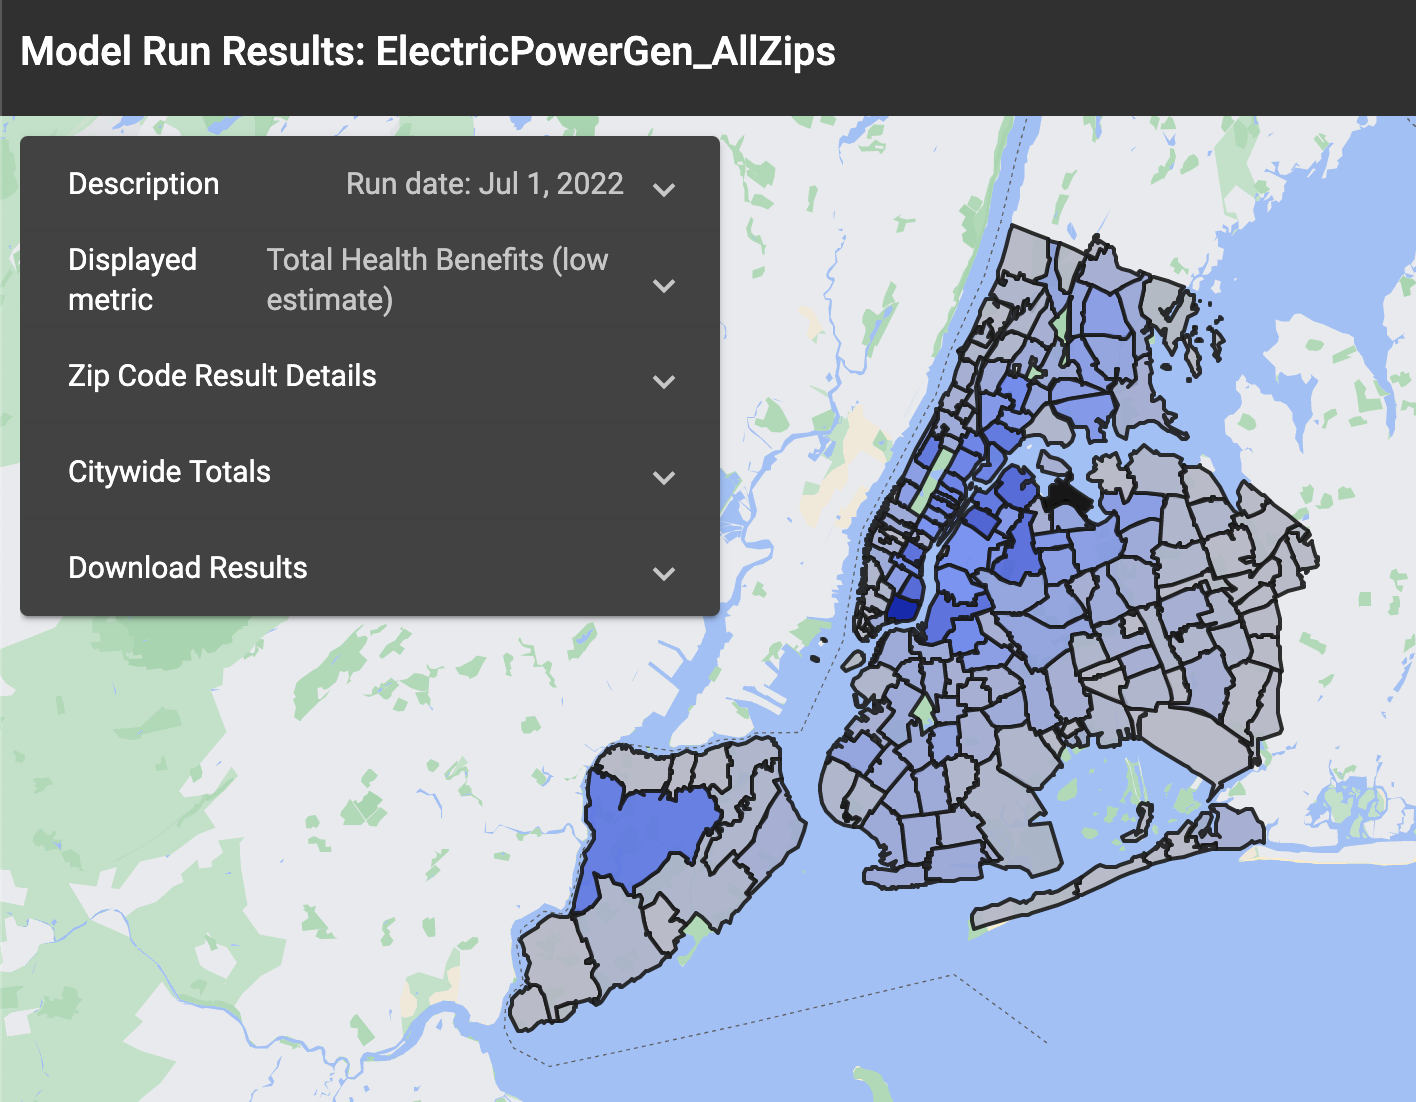
ZAPPA shows us that if we closed all the city’s power plants, we would see a fairly small reduction in average PM2.5 across the city: citywide PM2.5 would go down by 0.12 µg/m3. This would prevent only 5 deaths per million people aged 30 and older and avoid only 9 asthma emergency department visits per million people.
| Reductions in: | Value |
|---|---|
| PM2.5 (citywide average) | 0.12 µg/m3 |
| Deaths | 5 per 1,000,000 people 30 and above per year |
| Asthma ED visits | 9 per 1,000,000 people per year |
There may be more significant local effects in some ZIP Codes. To explore these, follow the directions below on how to run ZAPPA and get ZIP-Code level results.
Scenario 2: Which ZIP Codes would benefit the most from going car-free?
Some policy-makers are considering limiting vehicle use in parts of the City. Which limits would make the most difference?
- What if Midtown were a car-free zone?
- How would that compare to creating a car-free zone in the South Bronx?
- And, what if we eliminated vehicle traffic in the whole city?
Midtown has some of the worst air quality in all of NYC, while the South Bronx has some of the worst health impacts due to air quality. So, what would be the health impact of creating car-free zones in these neighborhoods?
If we stopped traffic from entering Midtown, we would see PM2.5 go down an average of 0.85 µg/m3 in those ZIP Codes, leading to about 37 fewer deaths per million people aged 30 and older and about 19 ED fewer visits for asthma per million people.
Instead, if we stopped traffic from entering the South Bronx, we would see PM2.5 go down an average of 0.20 µg/m3 in the corresponding ZIP Codes. ZAPPA shows us that each year, we would reduce annual deaths by 12 per million people aged 30 and older and avoid almost 33 ED visits for asthma per million people per year in the South Bronx.
And if we stopped traffic from entering any part of NYC, we would experience an average decrease of 0.46 µg/m3 in PM2.5 citywide, and as a result, there would be 20 fewer deaths per million for people aged 30 and older, and 20 ED visits for asthma avoided per million people.
Using ZAPPA, we learn that neighborhoods with higher air pollution see greater reductions in pollution, and neighborhoods with worse health impacts from air pollution would see greater health improvements than the citywide average.
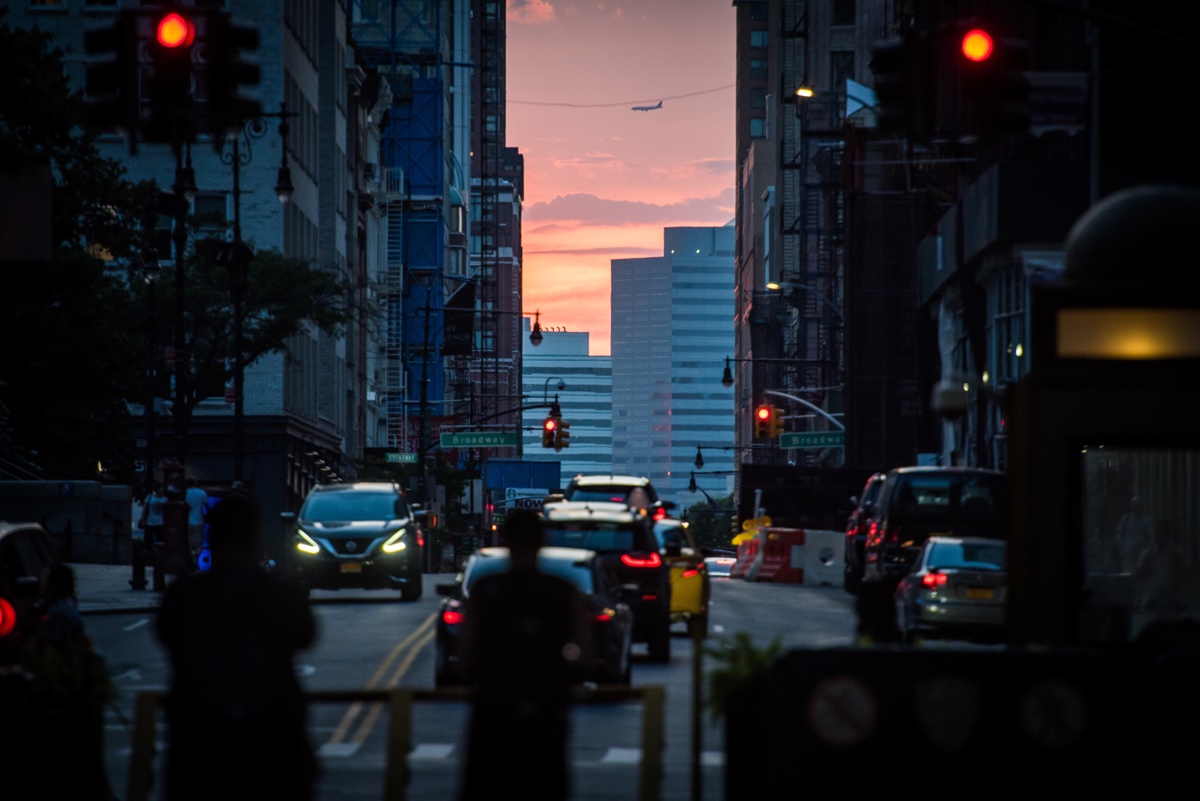
Ed Reed/Mayoral Photography Office, City of New York
Published on:
December 3, 2022