Initial data from Congestion Relief Tolling
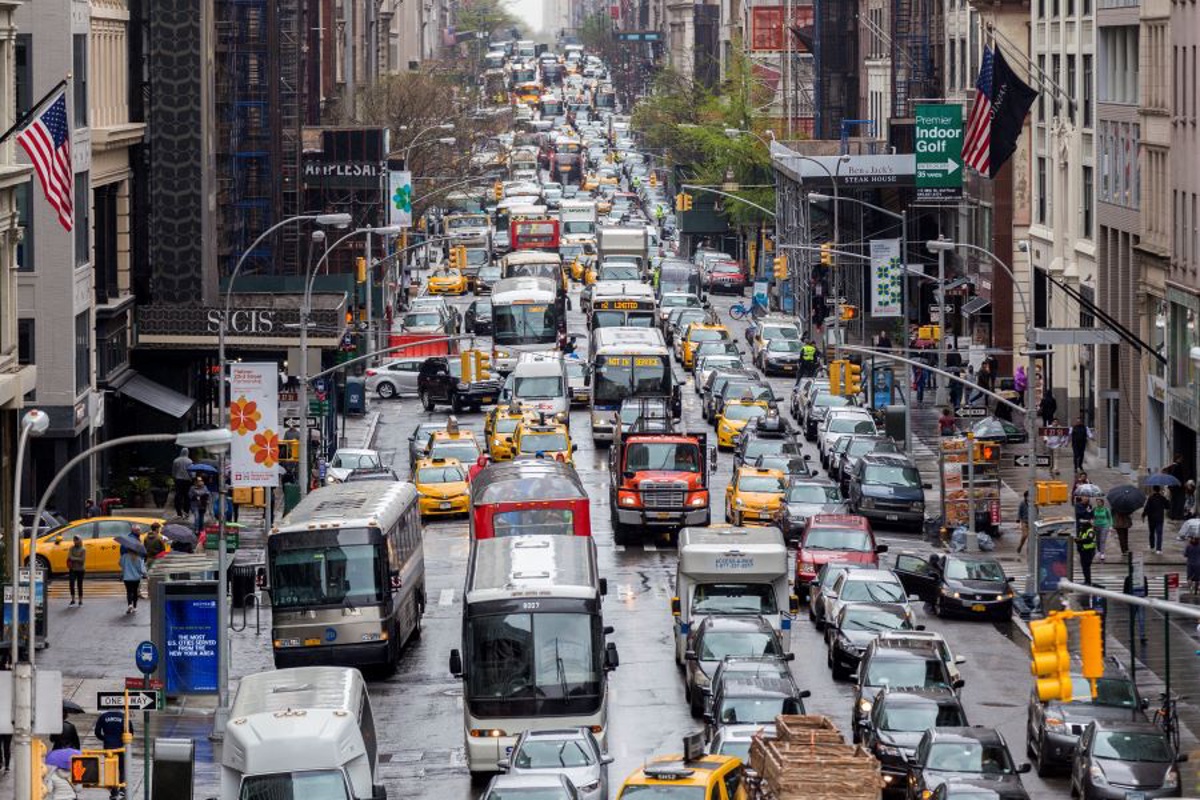
In January 2025, the Metropolitan Transportation Authority Bridge and Tunnels (MTABT) started charging a toll for vehicles entering Manhattan’s Congestion Relief Zone (the zone) to reduce traffic within the zone and raise money for public transportation improvements.
During the environmental review process, modeling did not identify air pollution as a concern to be tracked. However, due to community concerns, government agencies – including the Health Department, MTABT, the NYC Department of Transportation, and the New York State Department of Transportation – committed to monitor and report on air quality.
For this initial report, we looked at data for one kind of air pollution of particular concern, from locations both inside and outside the tolling zone, three months before the tolling started (from October to December 2024) and three months after tolling began (from January to March 2025). Generally, these early data show steady or decreasing levels of fine particle air pollution (or PM2.5) at most sites, both inside and outside the tolling zone.
But these data don’t let us draw final conclusions about the toll’s effect at this early stage. The work is ongoing - a comprehensive study will require 12 months of data before and after the start date. For that evaluation, we will use scientific methods that will separate the effects of the toll from other factors that can affect traffic and air quality – like the season, weather patterns, activity patterns, and more. We will publish that evaluation in 2026.
Where we measured air quality
This map shows the locations of real-time air quality monitoring, both inside and outside of the tolling zone. Locations outside of the zone were chosen based on the environmental review’s predictions that congestion relief tolling could increase traffic on some roads outside the zone.
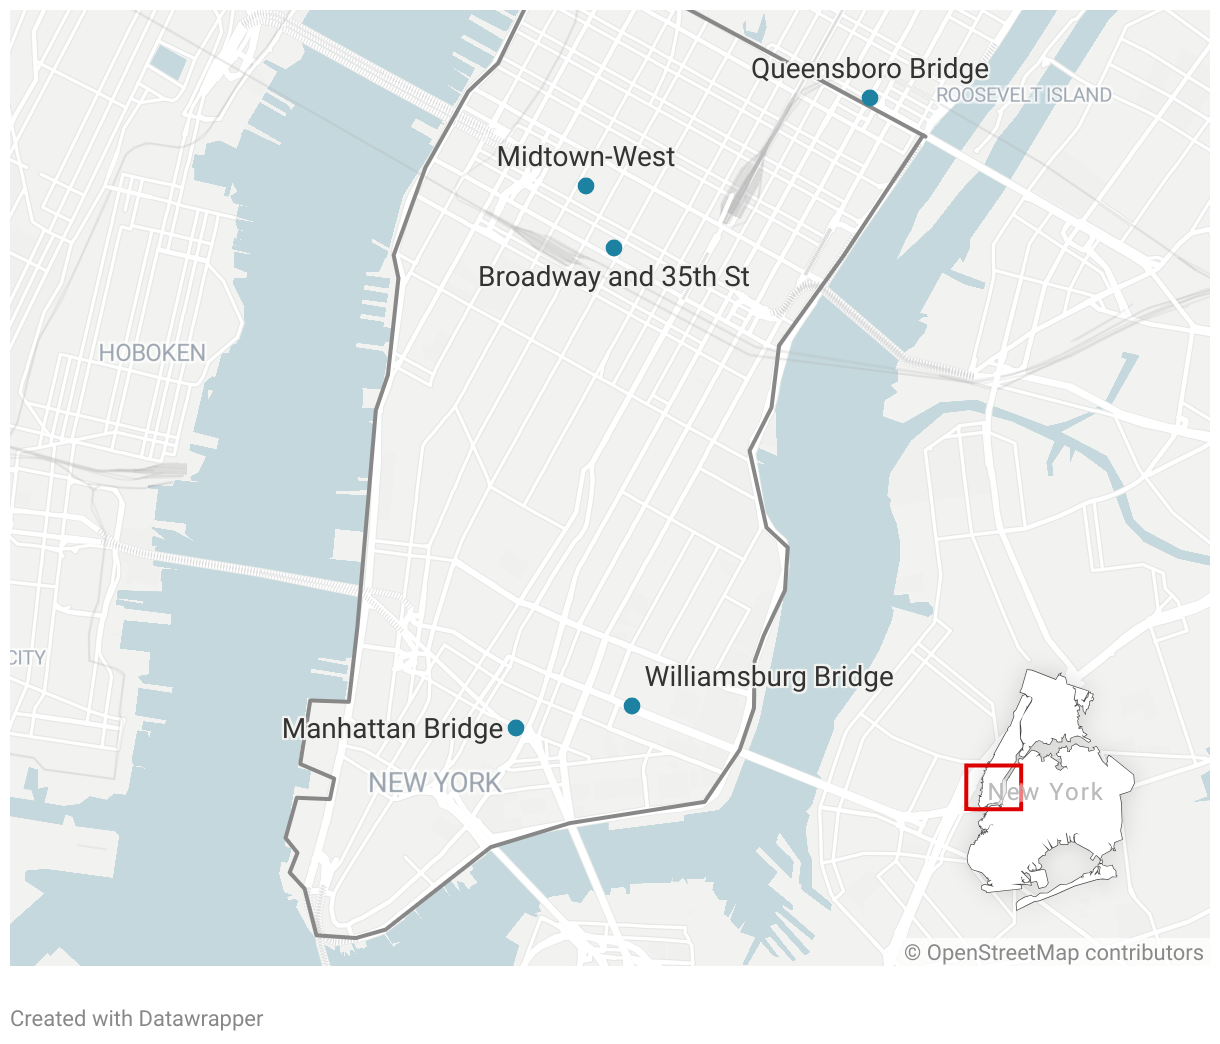
- Manhattan side of the Queensboro bridge, Williamsburg Bridge, and Manhattan Bridge.
- Broadway and 35th Street.
- Midtown West, on 39th street between 7th and 8th avenues.
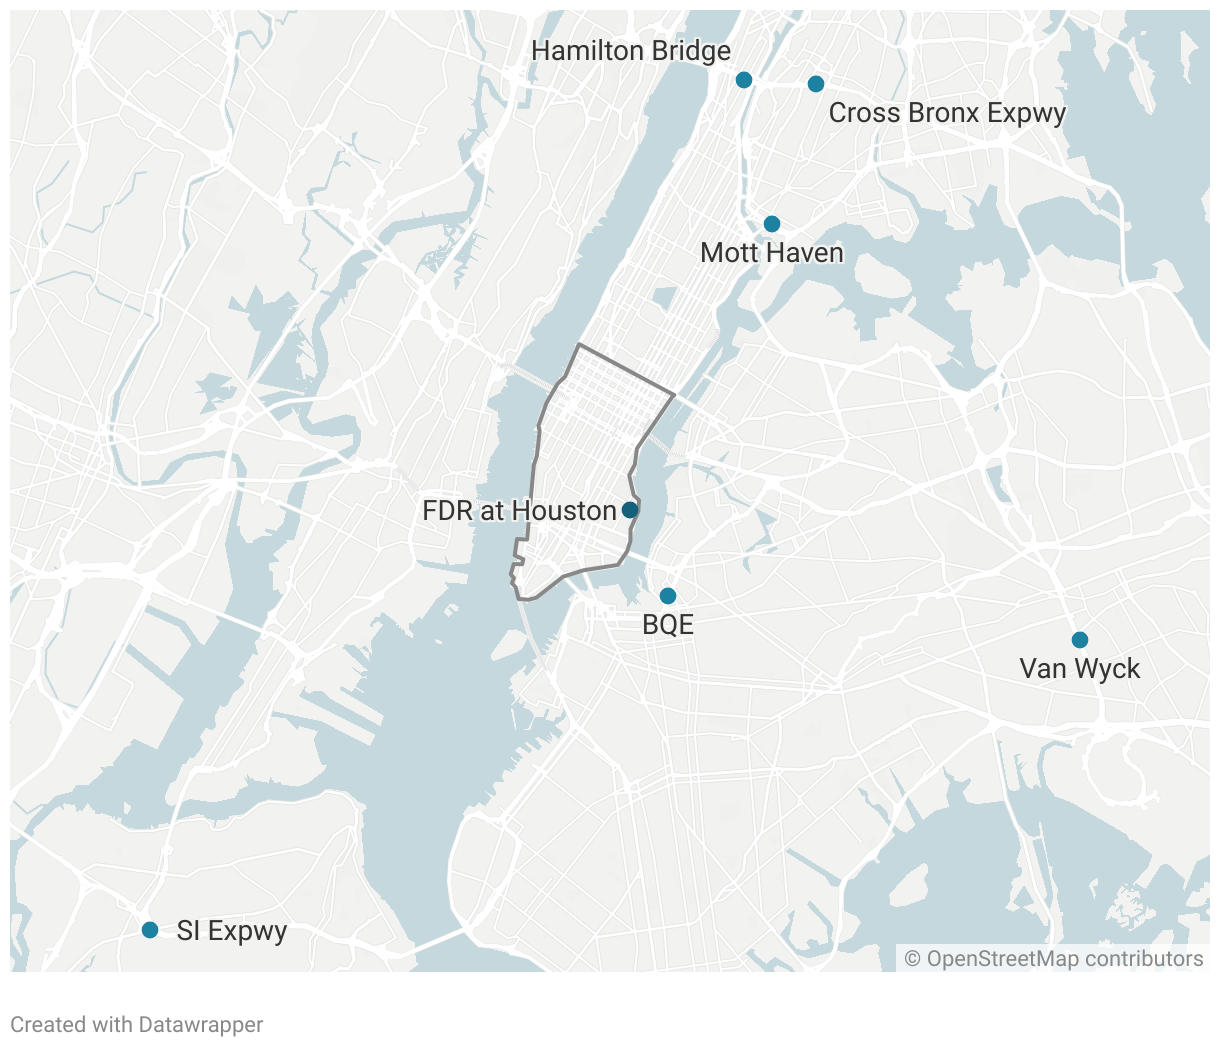
Monitors outside the tolling zone:
- Hamilton Bridge
- Cross Bronx Expressway
- Mott Haven
- FDR Drive at Houston
- BQE
- Van Wyck Expressway
- Staten Island Expressway
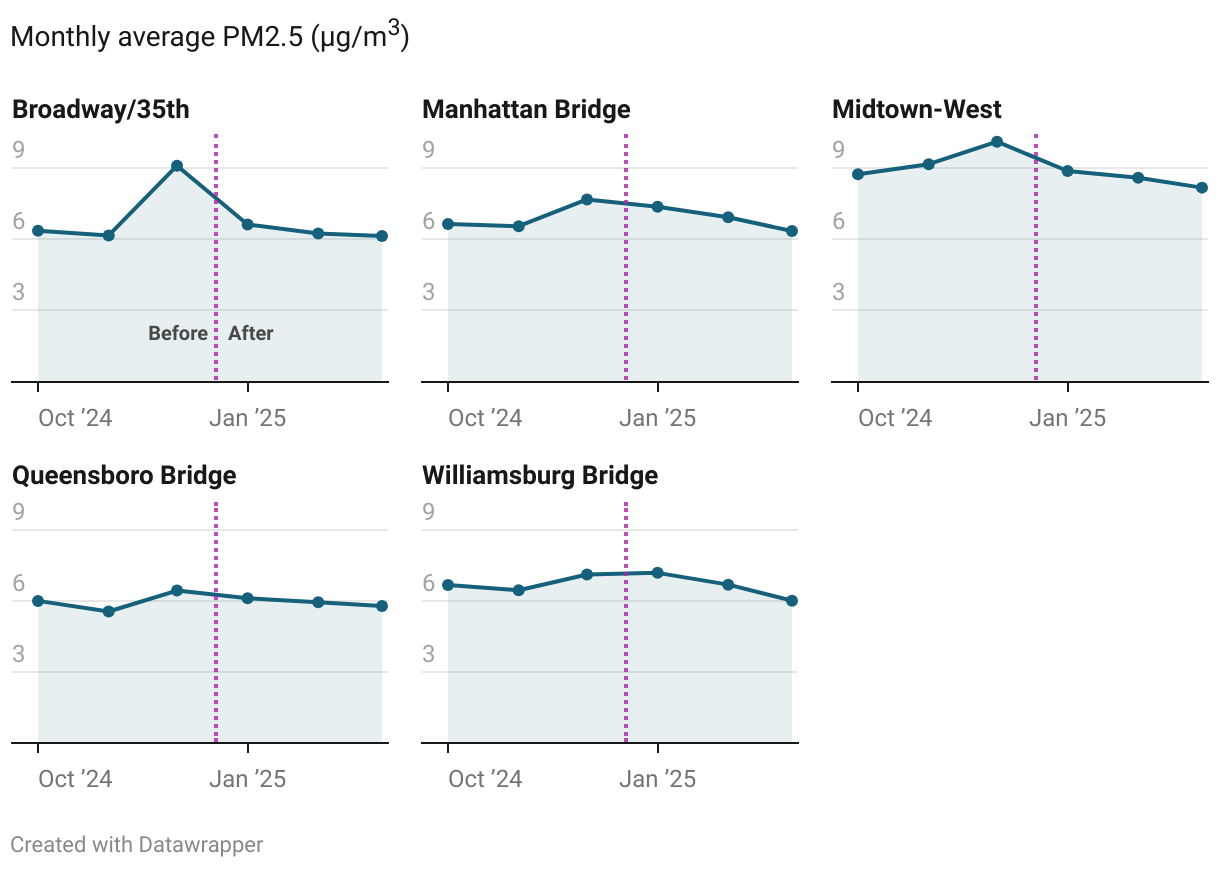
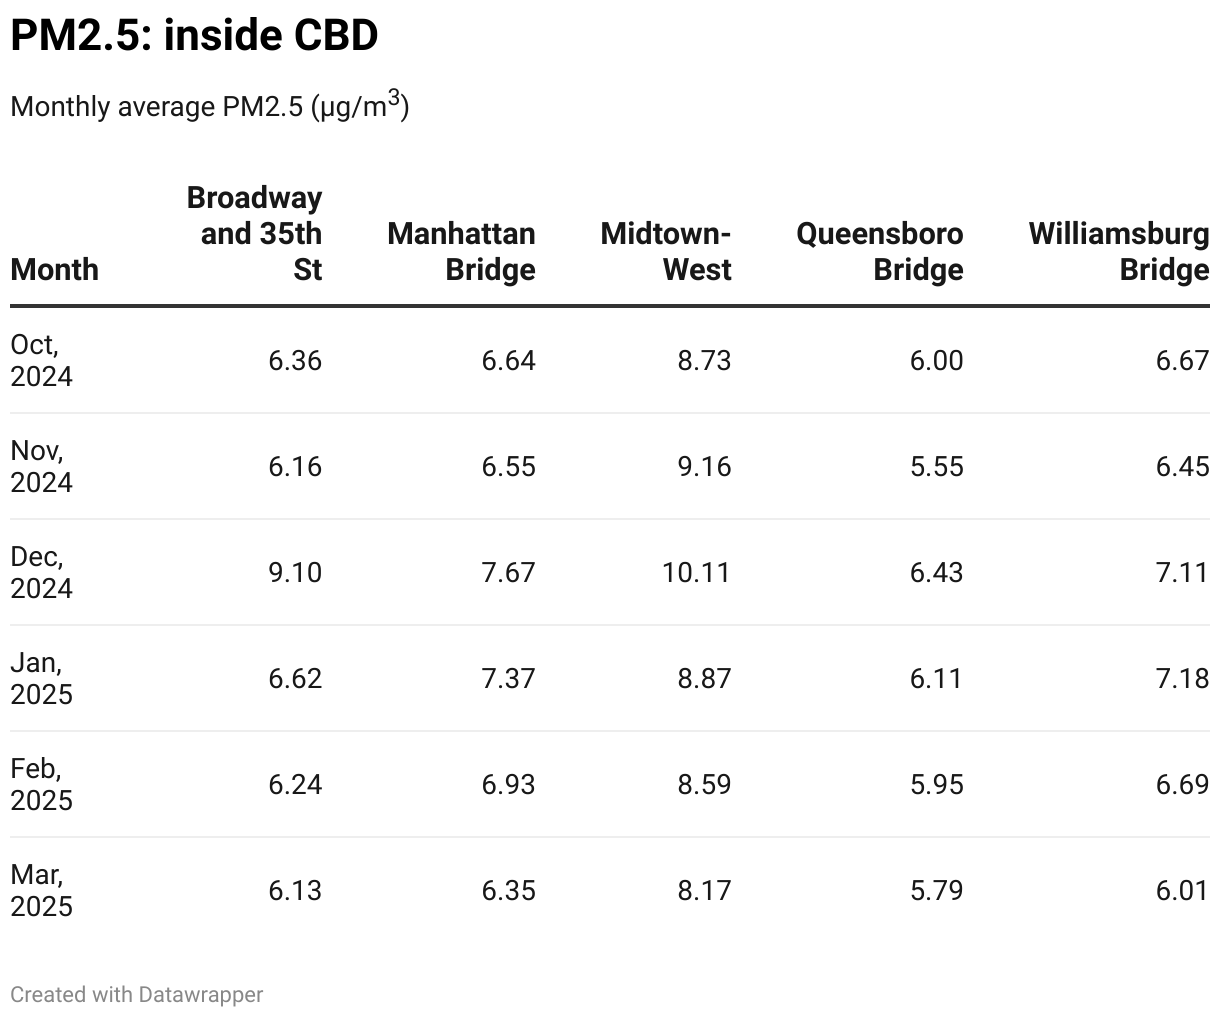
Inside the tolling zone: steady or decreasing levels of PM2.5
PM2.5, or fine particle air pollution, is a major form of air pollution that can harm health. Long-term exposure to PM2.5 increases risk of lung and heart disease, and short-term exposure increases risk of asthma.
Inside the tolling zone, PM2.5 levels dropped at several sites. Typically, we see PM2.5 levels rise in colder weather, as building boilers are turned on to heat buildings and emit pollution.
Most locations outside the zone also show steady or decreasing levels of PM2.5
Outside the tolling zone, we compared monthly average PM2.5 levels to a control site on the Van Wyck Expressway. This site is used as a control because it was not expected to be affected by the toll.
Most locations showed steady or decreasing concentrations of PM2.5.
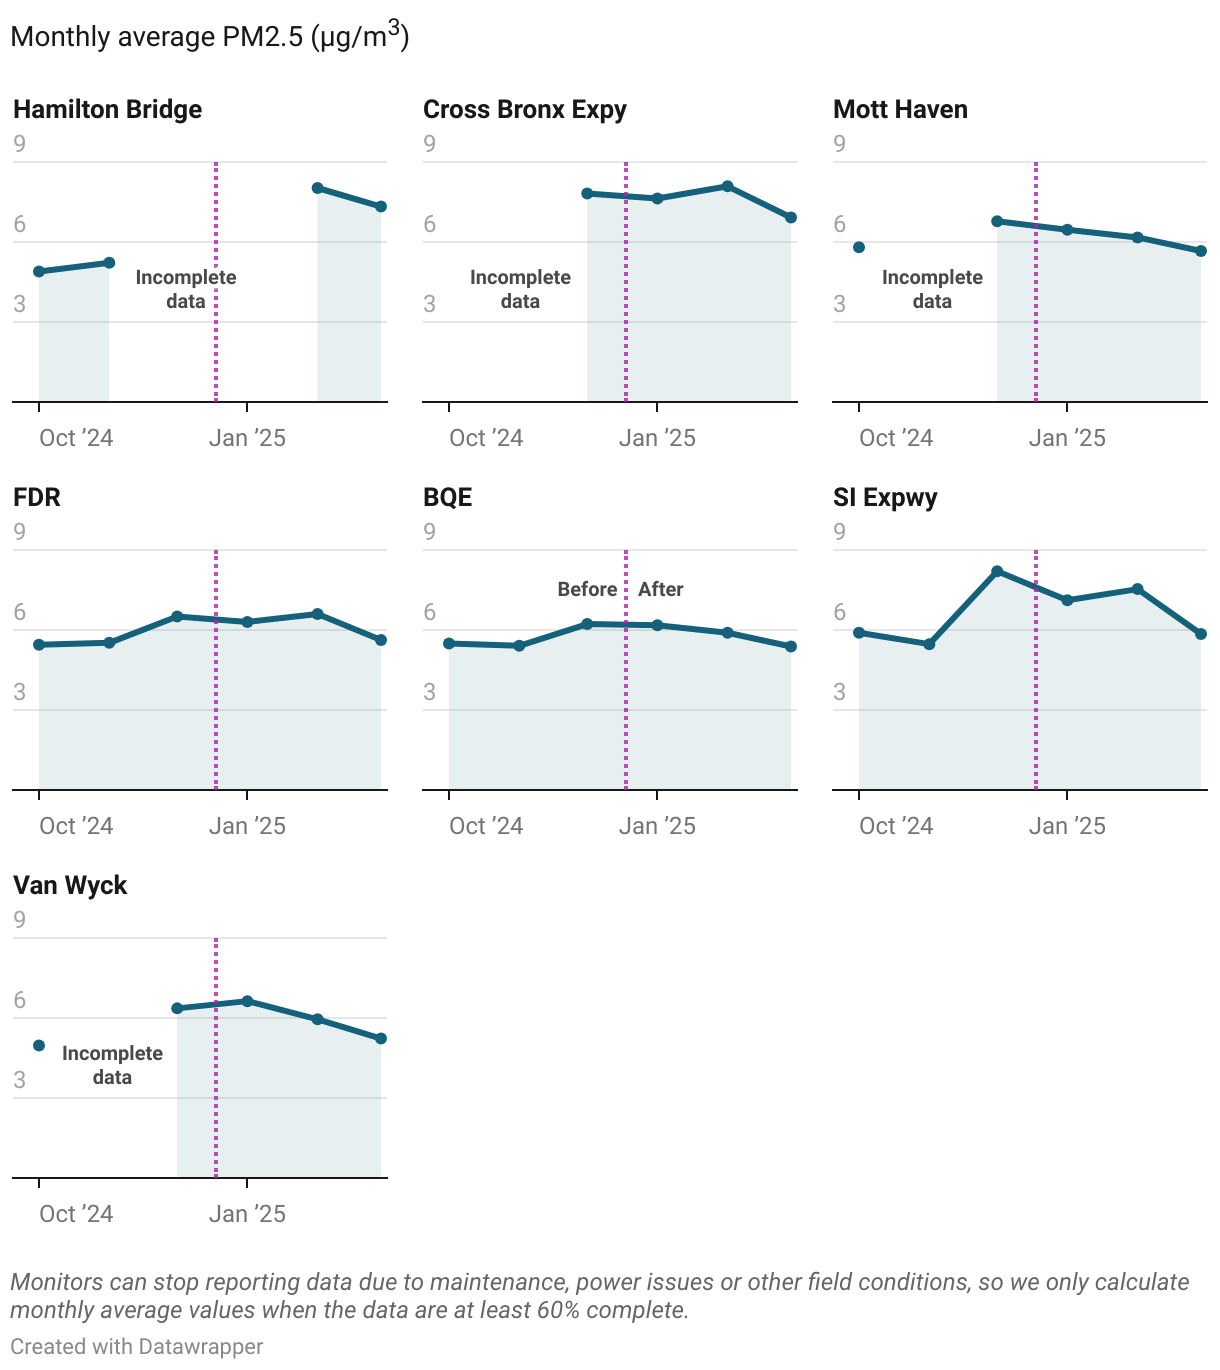
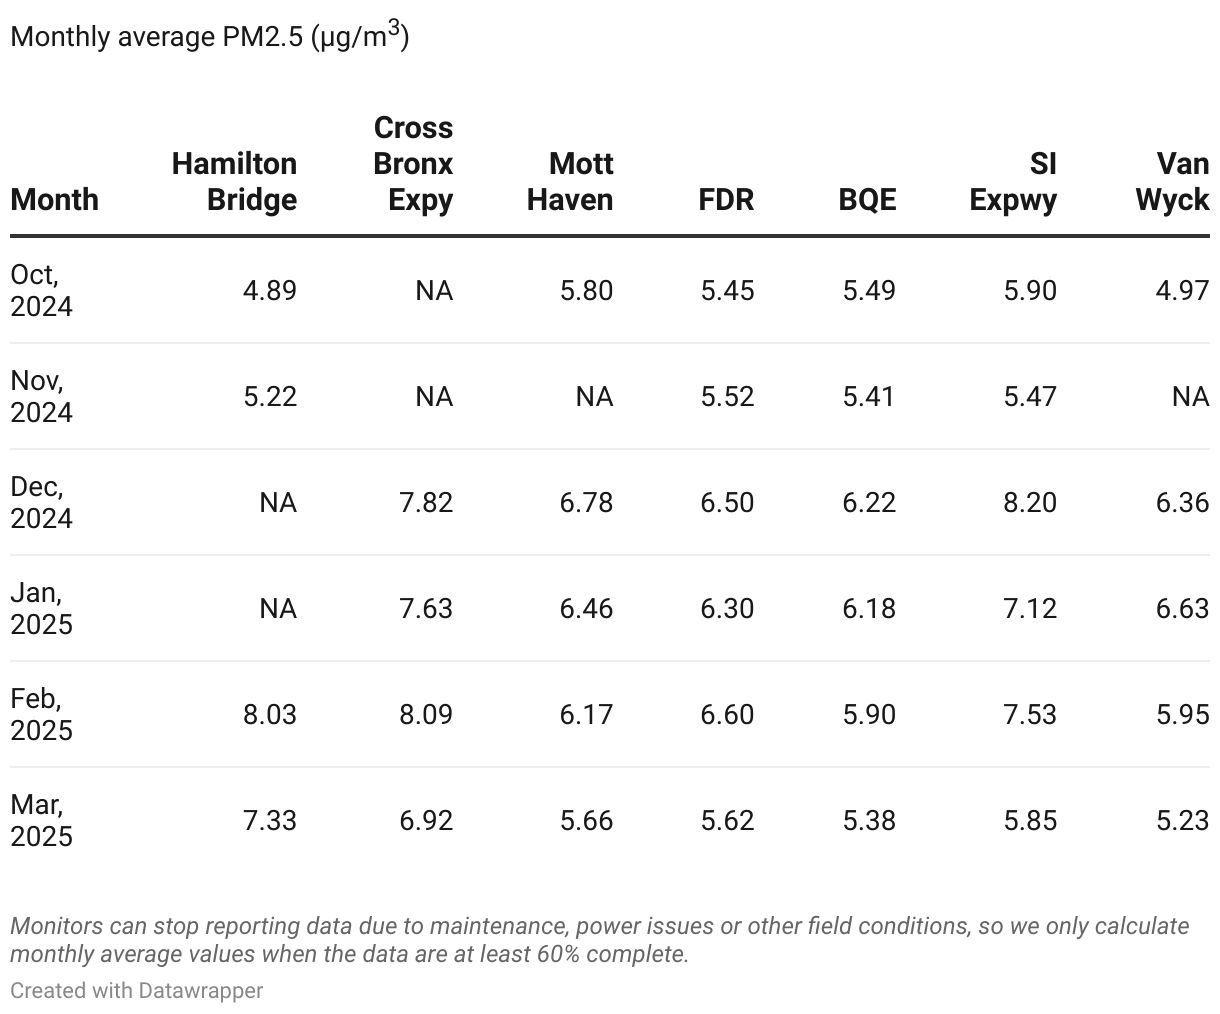
One location, Hamilton Bridge, showed an increase in PM2.5 pollution after tolling went into effect in January 2025. However, it’s not clear that this increase is caused by the tolling. Typically, air pollution is analyzed by connecting changes in air pollution to changes among the things that can emit that air pollution. PM2.5 is emitted by fuel combustion – from vehicles, building boilers, restaurants, and other sources. About 14% of the city’s PM2.5 comes from traffic.
Did this location see an increase in traffic that would explain this increase in PM2.5? Traffic counts at Hamilton Bridge show that from January to March 2025, counts of all vehicles and of trucks are comparable to a pre-tolling sample taken in October 2024. While more PM2.5 was observed in February 2025, we did not see an increase in traffic.
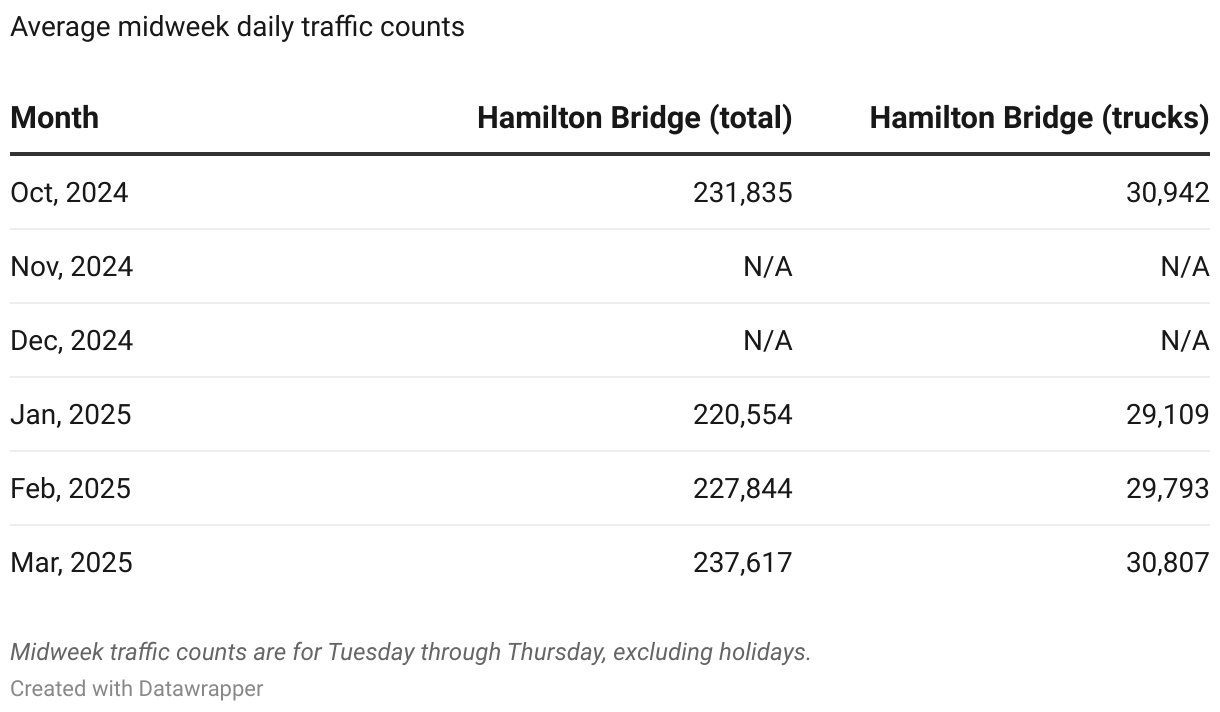
So, the increase in PM2.5 may be due to other sources of PM2.5. Air pollution amounts vary seasonally, especially from fall to winter. As the weather gets colder, building boilers burn more fuel to heat buildings, and emit more PM2.5. This area has a higher concentration of buildings with boilers that burn a type of fuel that emits more PM2.5.
Conclusion
Generally, New York City’s air quality is good, and improving over time.
In this initial look at air quality data from the first three months of congestion relief tolling, we observed steady or decreasing levels of PM2.5 at most sites, both inside and outside the tolling zone, including sites that were predicted to have traffic increases as a result of tolling.
While promising, we do not have enough data to draw final conclusions about the effects of congestion relief tolling on traffic and air quality. For reliable findings, we will analyze data from 12 months before and after the start of tolling. We will use analytical methods that will separate out the effects of the toll from other effects, like year-to-year changes in population and land use, seasonal variations, and other things that can affect traffic volume and air quality. That study will examine the effect of congestion relief tolling on the other pollutants typically examined by the New York City Community Air Survey. We expect to publish that evaluation in 2026.
Department of Transportation
Published on:
July 1, 2025